HP Z2 G9 2024, Core i7-14700, 16GB, 512GB SSD
The 20-core Intel Core i7-14700 processor delivers full-height workstation power in a compact, tool-less SFF chassis designed for 24/7 operation. Its front and rear ledges aid portability, while ISV certifications and HP Wolf Pro Security ensure reliable, protected performance for professional applications. This desktop is best for engineers and business users needing a space-saving, expandable workstation for certified CAD and data-intensive tasks, not GPU-driven gaming.
CPU Intel Core i7 14700
RAM 16 GB
Storage 512 GB
GPU Intel UHD Graphics 770
Form Factor sff
psu w 450
OS Windows 11 Pro

61 Gesamtbewertung
Derzeit kein aktueller Händlerpreis











Überblick
Vor- und Nachteile
Vorteile
- Strong port selection (90th percentile) 90th
- Strong cpu (83rd percentile) 83rd
- Strong reliability (70th percentile) 70th
Nachteile
Die Fakten
Leistung
Technische Daten
Alle technischen Daten
Processor
| CPU | Intel Core i7 14700 |
| Cores | 20 |
| Frequency | 2.1 GHz |
| L3 Cache | 33 MB |
Graphics
| GPU | Intel UHD Graphics 770 |
| Type | Integrated |
| VRAM Type | Shared |
Memory & Storage
| RAM | 16 GB |
| RAM Generation | DDR5 |
| Storage | 512 GB |
| Storage Type | NVMe SSD |
Build
| Form Factor | sff |
| PSU | 450 |
| Weight | 5.9 kg / 12.9 lbs |
Connectivity
| USB-C Ports | 1 |
| USB Ports | 10 |
| HDMI | 2x HDMI 1.4 |
| DisplayPort | 2x DisplayPort 1.4 |
| Ethernet | Gigabit Ethernet |
System
| OS | Windows 11 Pro |
Im Vergleich
| Spec | HP Z2 G9 | Apple Mac Studio M5 Max | Lenovo T Series Towers Legion Tower 5a Gen 10 | Dell Desktop ECT1250 | ASUS ROG GM700 | MSI Aegis ZS2 A9NVP-1407US |
|---|---|---|---|---|---|---|
| CPU | Intel Core i7 14700 | Apple M5 Max | AMD Ryzen 7 7800X3D | Intel Core Ultra 7 265 | AMD Ryzen 7 9800X3D | AMD Ryzen 9 9900X |
| RAM (GB) | 16 | 36 | 32 | 32 | 32 | 32 |
| Storage (GB) | 512 | 1024 | 4096 | 2048 | 2048 | 2048 |
| GPU | Intel UHD Graphics 770 | Apple (32-Core) | NVIDIA GeForce RTX 5070 Ti | Intel UHD Graphics | NVIDIA GeForce RTX 5070 Ti | NVIDIA GeForce RTX 5070 |
| Form Factor | sff | mini | mid-tower | sff | mid-tower | mid-tower |
| Psu W | 450 | 480 | 850 | 180 | 850 | 750 |
| OS | Windows 11 Pro | macOS | Windows 11 Home | Windows 11 Home | Windows 11 Home | Windows 11 Home |
| Compare | Compare | Compare | Compare | Compare |
| Produkt | CPU | GPU | RAM | Anschlüsse | Speicher | Zuverlässigkeit |
|---|---|---|---|---|---|---|
| HP Z2 G9 | 82.5 | 36.7 | 49.6 | 90.4 | 40.7 | 70 |
| Apple Mac Studio M5 Max Compare | 95.7 | 85.2 | 92.4 | 89 | 68.8 | 99.3 |
| Lenovo T Series Towers Legion Tower 5a Gen 10 Compare | 73.4 | 94.7 | 77.9 | 88.3 | 98.1 | 70 |
| Dell Desktop ECT1250 Compare | 88.2 | 60.3 | 81.6 | 74.5 | 82.7 | 70 |
| ASUS ROG GM700 Compare | 80.5 | 94.7 | 81.6 | 96 | 90 | 37.2 |
| MSI Aegis ZS2 A9NVP-1407US Compare | 92.4 | 90.8 | 87.1 | 90.4 | 82.7 | 37.2 |
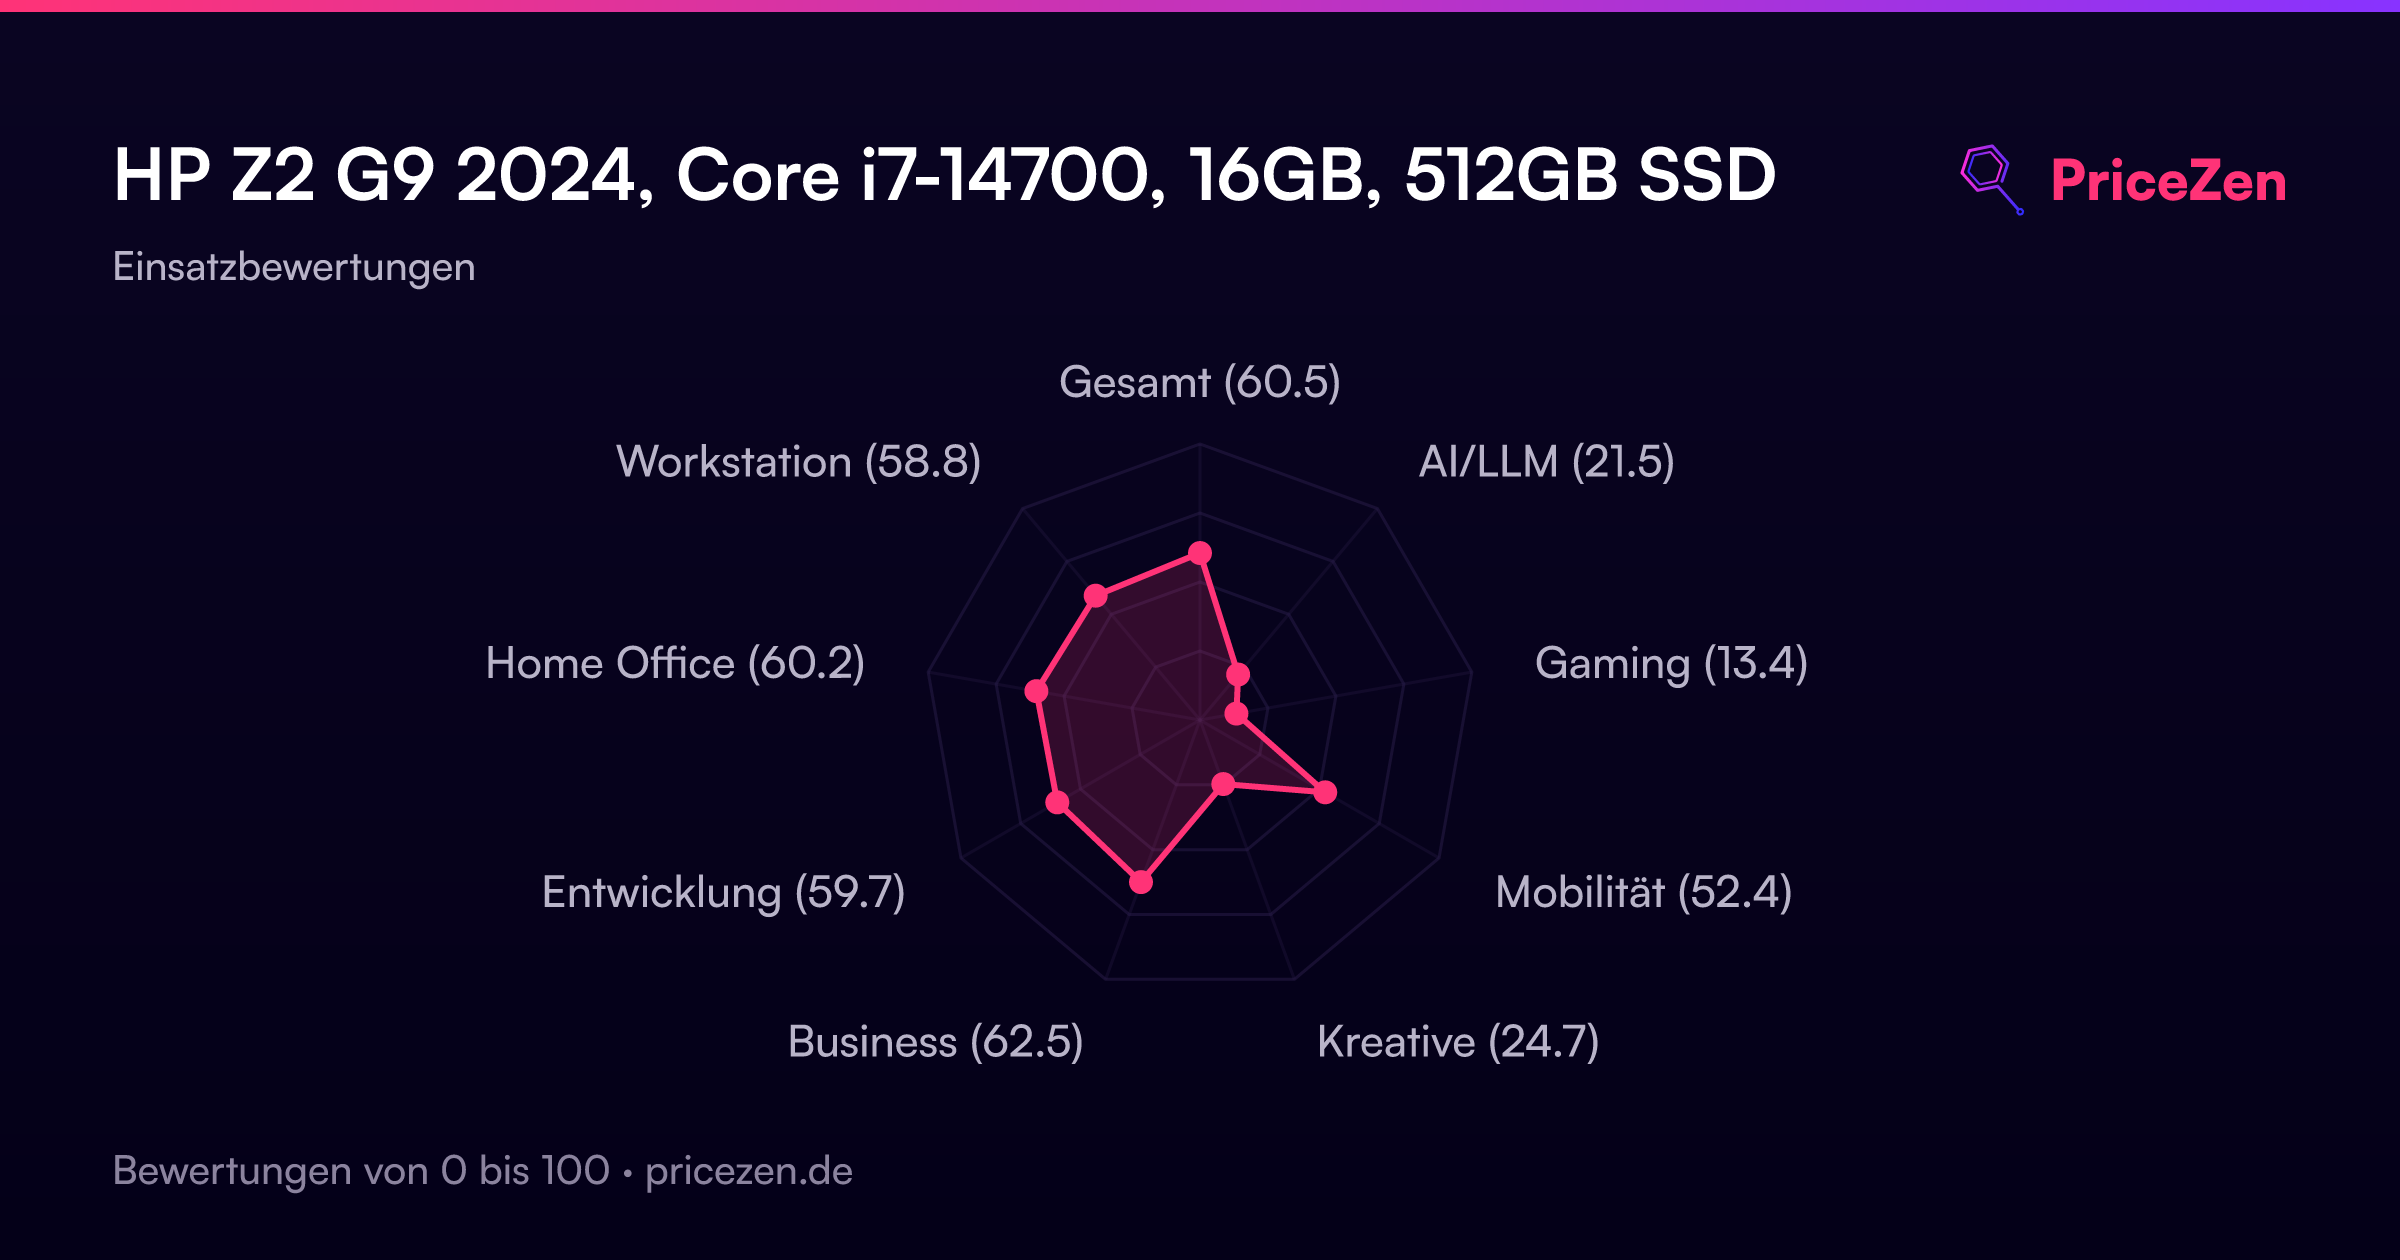
Bewertung nach Einsatzbereich
- Gesamt60.5
- AI/LLM21.6
- Gaming13.4
- Mobilität52.4
- Kreative24.8
- Business62.5
- Entwicklung59.8
- Home Office60.3
- Workstation58.9
Ein ausführlicher Testbericht folgt in Kürze. Die technischen Daten, Bewertungen, Preise und Diagramme oben sind stets aktuell.
Weitere Konfigurationen12
Z2 G9Intel Core i7 14700K32GB1TBZ2 G9Intel Core i7 14700K32GB1TBZ2 SFF G9Intel Core i7 1470016GB512GBZ2 G9Intel Core i9 14900K32GB1TBZ2 G9Intel Core i9 1490032GB1TBZ2 G9 A85R5UTIntel Core i7 1470064GB1TBZ2 G9 Workstation Z2 G9Intel Core i7 1470032GB1TBZ2 G9Intel Core i7 1470032GB512GBZ2 G9Intel Core i7 1470016GB512GB