MSI GeForce RTX 5060 Ti Ventus 2X OC Plus 16GB GDDR7 Black
The 16GB GDDR7 frame buffer and Blackwell architecture with 4608 CUDA cores provide ample memory for high-resolution textures and smooth 1440p gaming. Its compact 227mm dual-fan design fits easily into small form factor builds while still supporting modern connectivity like DisplayPort 2.1b and DLSS 4. This card is best for content creators and gamers upgrading from an older 60-class GPU who need strong ray tracing and AV1 encoding without a massive power supply.

Derzeit kein aktueller Händlerpreis


Überblick
Vor- und Nachteile
Vorteile
- Strong connectivity (94th percentile) 94th
- Strong feature (89th percentile) 89th
- Strong efficiency (86th percentile) 86th
- Strong social proof (84th percentile) 84th
Nachteile
Was Besitzer sagen
Wie sich die Meinung der Besitzer im Lauf der Zeit verändert hat
ExklusivBasierend darauf, wann Kunden ihre Bewertungen tatsächlich geschrieben haben - so sehen Sie, ob das anfängliche Lob anhielt.
49 geschriebene Rezensionen, Mai 2025 – Sept. 2026: 33 zufrieden, 1 gemischt, 15 ohne Sterne
Über alle 350 Shop-Bewertungen: 4,6★. Die meisten Besitzer bewerten, ohne eine Rezension zu schreiben. Das Diagramm zählt die 49 geschriebenen Rezensionen.
Jeder Punkt ist eine geschriebene Rezension, im Monat, in dem sie verfasst wurde. Zufrieden = 4-5★, gemischt = 3★, unzufrieden = 1-2★.
Die Fakten
Leistung
Technische Daten
Alle technischen Daten
Chipset
| GPU Chipset | GeForce RTX 5060 Ti |
| Brand | NVIDIA |
| Architecture | Blackwell |
| Class | consumer |
| Process | 5 |
Memory
| VRAM | 16 GB |
| Memory Type | GDDR7 |
| Memory Bus | 128 |
| Bandwidth | 448 |
Compute
| CUDA Cores | 4608 |
| Tensor Cores | 120 |
| RT Cores | 30 |
| Base Clock | 2587 |
| Boost Clock | 2602 |
| FP16 TFLOPS | 19.18 |
| FP32 TFLOPS | 19.18 |
Performance
| PassMark G3D | 22099 |
| GPU Compute | 10484 |
Power & Cooling
| TDP | 180 |
| Recommended PSU | 600 |
| Power Connectors | 8-Pin |
| Cooler | Dual Fan |
| Fans | 2 |
Connectivity
| Interface | PCI Express 5.0 x 16 (use x8) |
| DisplayPort | 3 |
| HDMI | 1 |
| Max Displays | 4 |
| Max Resolution | 7680 x 4320 |
Physical
| Length | 227 |
| Slot Width | 2 |
| Form Factor | Full Height |
| Weight | 1.0 kg / 2.1 lbs |
Features
| Ray Tracing | Yes |
| Upscaling | DLSS 4 |
| AV1 Encode | Yes |
| VR Ready | Yes |
| DirectX | 12 Ultimate |
| RGB | No |
Im Vergleich
| Spec | MSI GeForce RTX 5060 Ti Ventus 2X OC Plus | ASUS GeForce RTX 5090 TUF Gaming | Gigabyte GeForce RTX 5070 Ti Eagle Ice | ZOTAC GeForce RTX 5080 APOCALYPSE | PNY GeForce RTX 5080 ARGB OC | Sapphire Radeon RX 9070 XT PULSE |
|---|---|---|---|---|---|---|
| Chipset | GeForce RTX 5060 Ti | GeForce RTX 5090 | GeForce RTX 5070 Ti | GeForce RTX 5080 | GeForce RTX 5080 | Radeon RX 9070 XT |
| Vram | 16GB GDDR7 | 32GB GDDR7 | 16GB GDDR7 | 16GB GDDR7 | 16GB GDDR7 | 16GB GDDR6 |
| Boost Clock Mhz | 2602 | 2407 | 2542 | 2730 | 2620 | 2970 |
| Tdp W | 180 | 575 | 300 | 360 | 360 | 304 |
| Memory Bus Bits | 128 | 512 | 256 | 256 | 256 | 256 |
| Ray Tracing | true | true | true | true | true | true |
| GPU Class | consumer | consumer | consumer | consumer | consumer | consumer |
| Compare | Compare | Compare | Compare | Compare |
| Produkt | AI | Rt | Vram | Raster | Compute | Feature | Thermal | Efficiency | Connectivity | Nutzerresonanz | Affordability |
|---|---|---|---|---|---|---|---|---|---|---|---|
| MSI GeForce RTX 5060 Ti Ventus 2X OC Plus | 68.7 | 64.9 | 83 | 56.4 | 50.9 | 89 | 55.4 | 85.9 | 94.1 | 83.8 | 44.6 |
| ASUS GeForce RTX 5090 TUF Gaming Compare | 97.1 | 90.5 | 97.7 | 98.8 | 97.7 | 96 | 72.3 | 24.2 | 99.3 | 98.7 | 2.3 |
| Gigabyte GeForce RTX 5070 Ti Eagle Ice Compare | 79.6 | 88.6 | 86 | 89 | 88.2 | 96 | 91.6 | 72.2 | 94.1 | 93.3 | 26.8 |
| ZOTAC GeForce RTX 5080 APOCALYPSE Compare | 85.6 | 97.5 | 89 | 94.5 | 93.5 | 96 | 91.6 | 57.1 | 94.1 | 98.7 | 20.2 |
| PNY GeForce RTX 5080 ARGB OC Compare | 85.6 | 97.5 | 89 | 94.5 | 93.5 | 96 | 91.6 | 57.1 | 94.1 | 74.8 | 14.4 |
| Sapphire Radeon RX 9070 XT PULSE Compare | 89.3 | 84.7 | 73.8 | 75.3 | 90.2 | 96 | 72.3 | 45.7 | 88.8 | 93.3 | 43.3 |
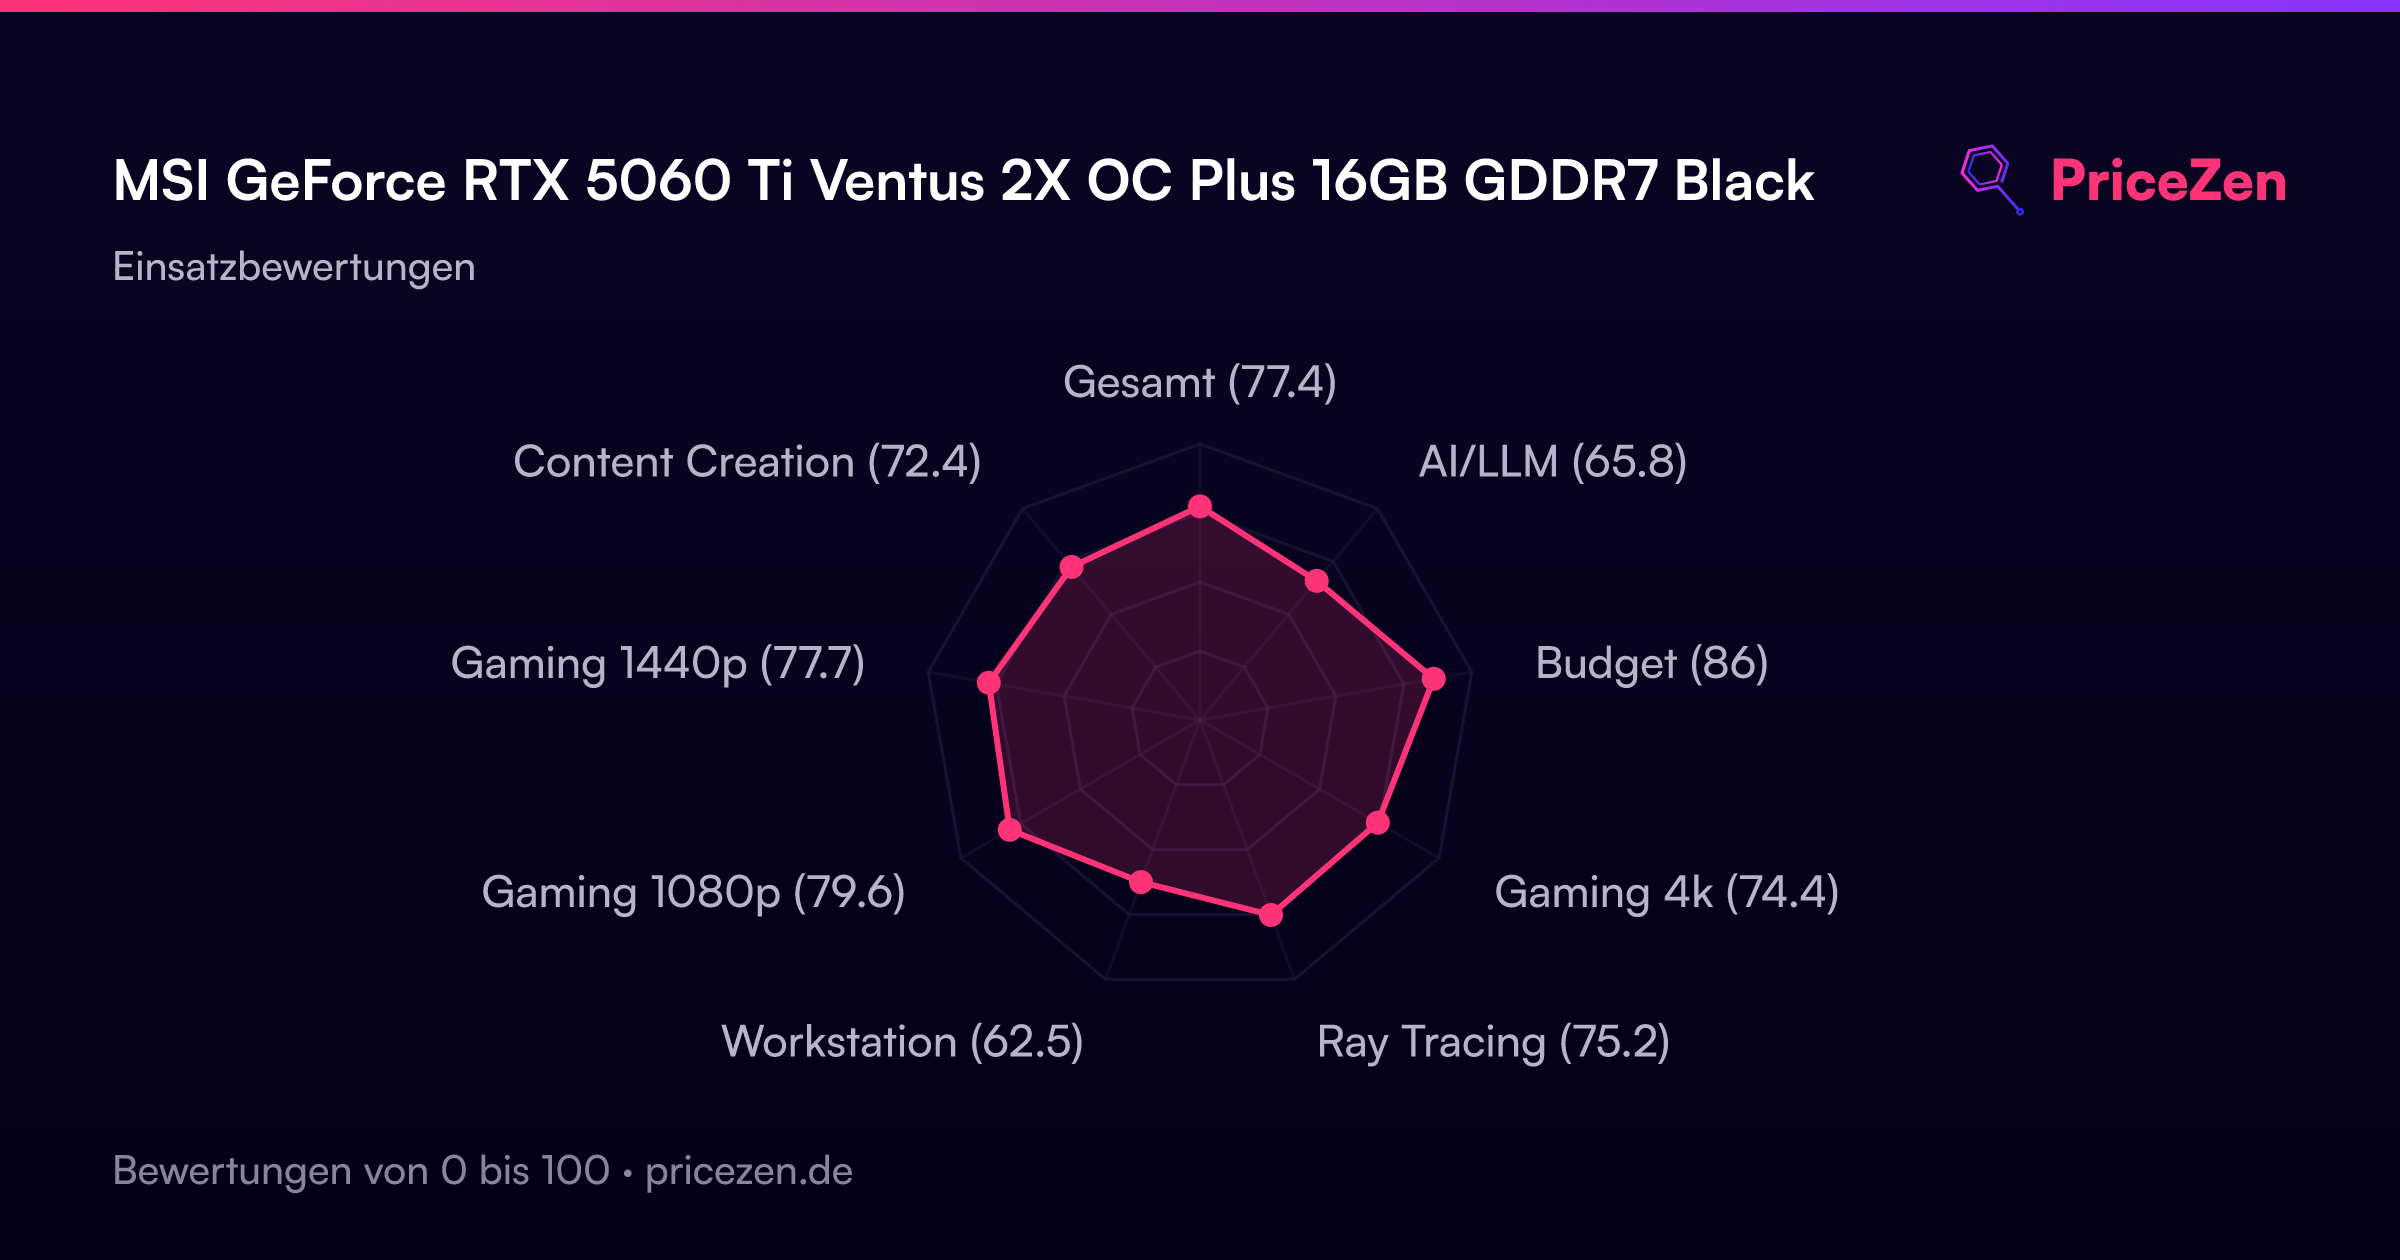
Bewertung nach Einsatzbereich
- Gesamt77.4
- AI/LLM65.8
- Budget86
- Gaming 4k74.4
- Ray Tracing75.2
- Workstation62.5
- Gaming 1080p79.6
- Gaming 1440p77.7
- Content Creation72.4
Ein ausführlicher Testbericht folgt in Kürze. Die technischen Daten, Bewertungen, Preise und Diagramme oben sind stets aktuell.