Dell XPS 13 9310 2021, Core i7-1195G7, 16GB, 512GB SSD, Platinum Silver
CPU Intel Core i7 1195G7
RAM 16 GB
Storage 512 GB
Screen 13.4" 3840x2160
GPU Intel Iris Xe Graphics
OS Windows 11 Home
Weight 1.3 kg

50 Gesamtbewertung
Derzeit kein aktueller Händlerpreis










Überblick
Vor- und Nachteile
Vorteile
- Strong screen (98th percentile) 98th
- Strong portability (93rd percentile) 93rd
Nachteile
- Below average port selection (20th percentile)
- Below average affordability (28th percentile)
- Below average reliability (34th percentile)
Die Fakten
Leistung
Technische Daten
Alle technischen Daten
Processor
| CPU | Intel Core i7 1195G7 |
| Cores | 4 |
| Frequency | 2.9 GHz |
| L3 Cache | 12 MB |
Graphics
| GPU | Intel Iris Xe Graphics |
| Type | Integrated |
| VRAM Type | Shared |
Memory & Storage
| RAM | 16 GB |
| RAM Generation | LPDDR4X |
| Storage | 512 GB |
| Storage Type | NVMe SSD |
Display
| Size | 13.4" |
| Resolution | 3840x2160 (4K UHD) |
| Panel | OLED |
| Refresh Rate | 60 Hz |
| Brightness | 500 nits |
Connectivity
| Wi-Fi | Wi-Fi 6 |
| Bluetooth | Bluetooth 5.1 |
Physical
| Weight | 1.3 kg / 2.8 lbs |
| OS | Windows 11 Home |
Im Vergleich
| Spec | Dell XPS 13 9310 | Apple MacBook Pro 14.2" M4 Max | ASUS ROG Zephyrus 14" GA403WW-G14.R95080 | Lenovo Legion Pro 7i Gen 10 16" | HP OMEN Transcend | Samsung Galaxy Book5 Pro 14" NP944XHA-KG3US |
|---|---|---|---|---|---|---|
| CPU | Intel Core i7 1195G7 | Apple M4 Max | AMD Ryzen AI 9 HX 370 | Intel Core Ultra 9 275HX | Intel Core Ultra 9 285H | Intel Core Ultra 7 258V |
| RAM (GB) | 16 | 64 | 32 | 32 | 32 | 32 |
| Storage (GB) | 512 | 4096 | 2048 | 1024 | 1024 | 1024 |
| Screen | 13.4" 3840x2160 | 14.2" 3024x1964 | 14" 2880x1800 | 16" 2560x1600 | 14" 2880x1800 | 14" 2880x1800 |
| GPU | Intel Iris Xe Graphics | Apple (40-Core) | NVIDIA GeForce RTX 5080 | NVIDIA GeForce RTX 5070 Ti | NVIDIA GeForce RTX 5070 | Intel Arc Graphics 140V |
| OS | Windows 11 Home | macOS | Windows 11 Home | Windows 11 Home | Windows 11 Home | Windows 11 Pro |
| Weight (kg) | 1.3 | 1.6 | 1.6 | 2.7 | 1.6 | 1.2 |
| Battery (Wh) | - | 72 | - | 99 | 71 | 63 |
| Compare | Compare | Compare | Compare | Compare |
| Produkt | CPU | GPU | RAM | Anschlüsse | Display | Mobilität | Speicher | Zuverlässigkeit | Affordability |
|---|---|---|---|---|---|---|---|---|---|
| Dell XPS 13 9310 | 36.7 | 47.7 | 46.1 | 20 | 98 | 93.4 | 50.8 | 33.6 | 28.4 |
| Apple MacBook Pro 14.2" M4 Max Compare | 93.7 | 91.6 | 95.7 | 73.2 | 99.3 | 68.8 | 98.5 | 98.3 | 1.7 |
| ASUS ROG Zephyrus 14" GA403WW-G14.R95080 Compare | 91.2 | 98.3 | 90.9 | 89.2 | 96.5 | 73.6 | 89.7 | 60.6 | 5.7 |
| Lenovo Legion Pro 7i Gen 10 16" Compare | 97.2 | 96.6 | 89 | 97.2 | 95.6 | 9.5 | 79.2 | 82 | 5.5 |
| HP OMEN Transcend Compare | 90.1 | 93.6 | 89.7 | 89.2 | 96.5 | 72.2 | 65.2 | 33.6 | 8.3 |
| Samsung Galaxy Book5 Pro 14" NP944XHA-KG3US Compare | 65.8 | 69.7 | 79.5 | 83.1 | 91.5 | 89.5 | 79.2 | 82 | 20 |
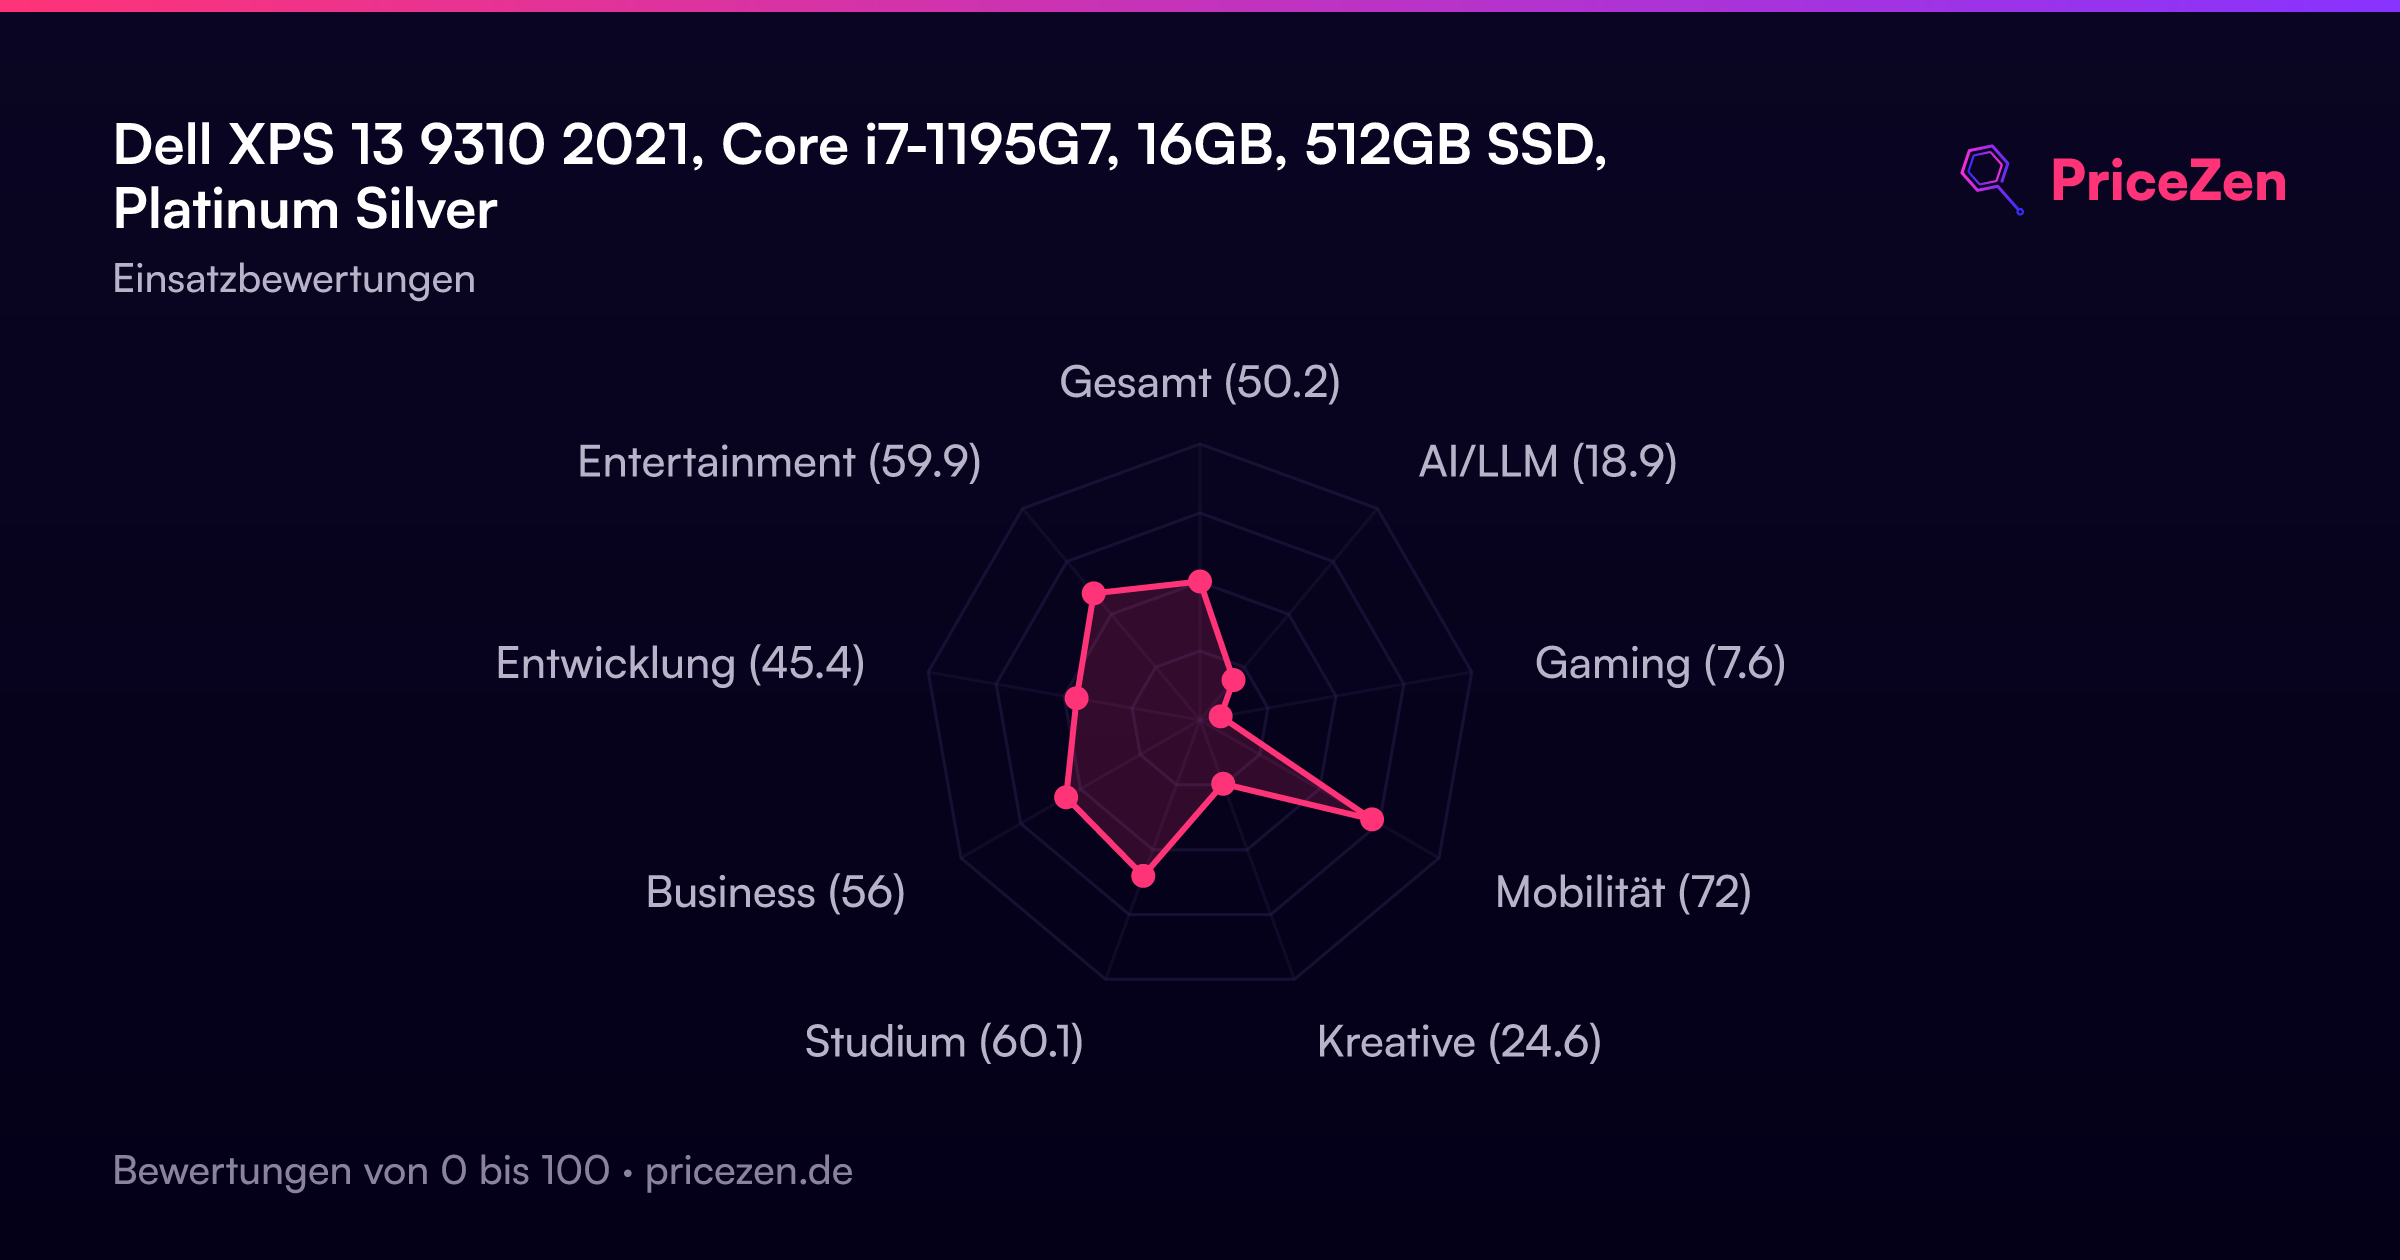
Bewertung nach Einsatzbereich
- Gesamt50.2
- AI/LLM18.9
- Gaming7.6
- Mobilität72
- Kreative24.6
- Studium60.1
- Business56
- Entwicklung45.4
- Entertainment59.9
Ein ausführlicher Testbericht folgt in Kürze. Die technischen Daten, Bewertungen, Preise und Diagramme oben sind stets aktuell.