Apple MacBook Air 13.3" Retina 2018, Core i5, 8GB, 256GB SSD, Gold
The wedge-shaped recycled aluminum design at just 1.25kg and the 2560x1600 Retina display with 100% sRGB coverage remain standout physical attributes, despite the aging dual-core Intel i5-8210Y processor and 8GB of LPDDR3 RAM. The inclusion of Touch ID and a dual Thunderbolt 3 port setup provides secure authentication and versatile connectivity in an ultraportable chassis. This machine is best for students or writers who prioritize macOS, a premium fanless build, and a sharp display for basic productivity tasks over raw performance.

Derzeit kein aktueller Händlerpreis
Überblick
Vor- und Nachteile
Vorteile
- Strong reliability (98th percentile) 98th
- Strong portability (95th percentile) 95th
- Strong screen (85th percentile) 85th
- Strong affordability (73rd percentile) 73rd
Nachteile
- Below average ram (5th percentile)
- Below average cpu (6th percentile)
- Below average storage (16th percentile)
- Below average gpu (28th percentile)
Was Besitzer sagen
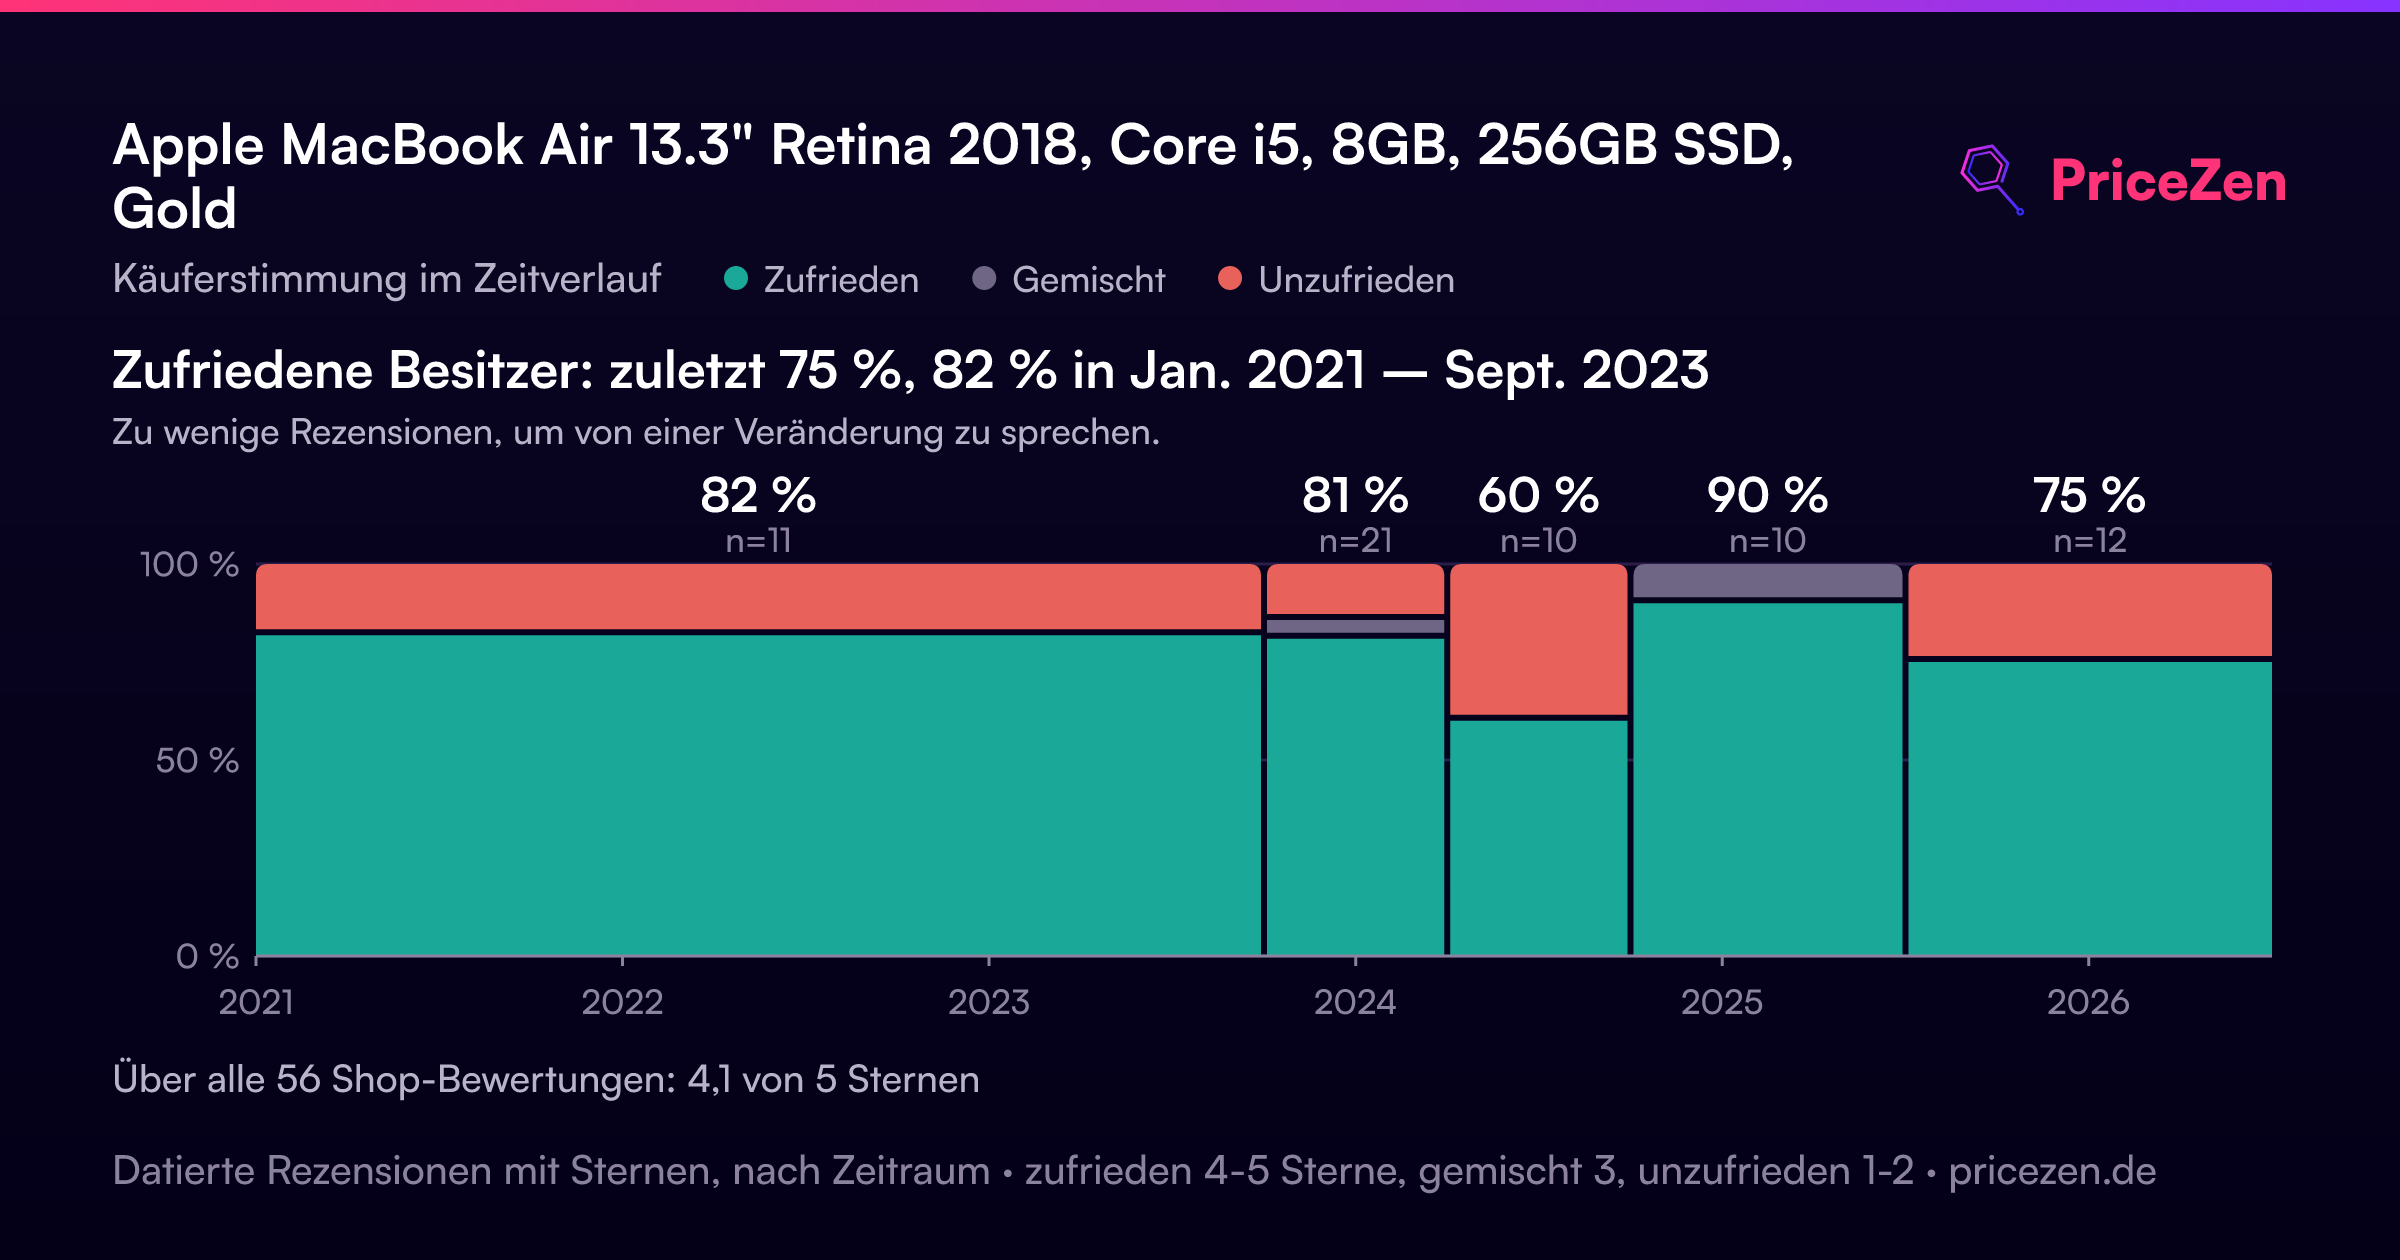
Wie sich die Meinung der Besitzer im Lauf der Zeit verändert hat
ExklusivBasierend darauf, wann Kunden ihre Bewertungen tatsächlich geschrieben haben - so sehen Sie, ob das anfängliche Lob anhielt.
Zufriedene Besitzer: zuletzt 75 %, 82 % in Jan. 2021 – Sept. 2023
Zu wenige Rezensionen, um von einer Veränderung zu sprechen.
Über alle 56 Shop-Bewertungen: 4,1★. Das Diagramm zählt die 64 geschriebenen Rezensionen mit Sternen und eigenem Datum.
Zahlen anzeigen
| Zeitraum | Rezensionen | Zufrieden | Gemischt | Unzufrieden | Anteil zufrieden |
|---|---|---|---|---|---|
| Jan. 2021 – Sept. 2023 | 11 | 9 | 0 | 2 | 82 % |
| Okt. 2023 – März 2024 | 21 | 17 | 1 | 3 | 81 % |
| Apr.–Sept. 2024 | 10 | 6 | 0 | 4 | 60 % |
| Okt. 2024 – Juni 2025 | 10 | 9 | 1 | 0 | 90 % |
| Juli 2025 – Juni 2026 | 12 | 9 | 0 | 3 | 75 % |
Jede Säule fasst Quartale zusammen, bis sie mindestens 10 Rezensionen mit Sternen und eigenem Datum enthält. Zufrieden = 4-5★, gemischt = 3★, unzufrieden = 1-2★.
Die Fakten
Leistung
Technische Daten
Alle technischen Daten
Processor
| CPU | Intel 8th Generation Core i5 |
| Cores | 2 |
| Frequency | 1.6 GHz |
Graphics
| GPU | Intel UHD Graphics 617 |
| Type | Integrated |
| VRAM Type | Shared |
Memory & Storage
| RAM | 8 GB |
| RAM Generation | LPDDR3 |
| Storage | 256 GB |
| Storage Type | SSD |
Display
| Size | 13.3" |
| Resolution | 2560x1600 (QHD) |
| Panel | IPS |
| Brightness | 300 nits |
| Color Gamut | 100% sRGB |
Connectivity
| USB-C Ports | 2 |
| USB Ports | 0 |
| Thunderbolt | Thunderbolt 3 |
| Wi-Fi | Wi-Fi 5 |
| Bluetooth | Bluetooth 4.2 |
| Ethernet | 10/100/1000 |
Physical
| Weight | 1.2 kg / 2.7 lbs |
| Battery | 50 Wh |
| OS | macOS |
Im Vergleich
| Spec | Apple MacBook Air 13.3" Retina | ASUS ROG Zephyrus 14" GA403WW-G14.R95080 | Lenovo Legion Pro 7i Gen 10 16" | HP OMEN Transcend | Samsung Galaxy Book5 Pro 14" NP944XHA-KG3US | Dell Premium 14.5" LDA14250-7667SLV-PUS |
|---|---|---|---|---|---|---|
| CPU | Intel 8th Generation Core i5 | AMD Ryzen AI 9 HX 370 | Intel Core Ultra 9 275HX | Intel Core Ultra 9 285H | Intel Core Ultra 7 258V | Intel Core Ultra 7 255H |
| RAM (GB) | 8 | 32 | 32 | 32 | 32 | 32 |
| Storage (GB) | 256 | 2048 | 1024 | 1024 | 1024 | 1024 |
| Screen | 13.3" 2560x1600 | 14" 2880x1800 | 16" 2560x1600 | 14" 2880x1800 | 14" 2880x1800 | 14.5" 3200x2000 |
| GPU | Intel UHD Graphics 617 | NVIDIA GeForce RTX 5080 | NVIDIA GeForce RTX 5070 Ti | NVIDIA GeForce RTX 5070 | Intel Arc Graphics 140V | Intel Arc Graphics |
| OS | macOS | Windows 11 Home | Windows 11 Home | Windows 11 Home | Windows 11 Pro | Windows 11 Home |
| Weight (kg) | 1.2 | 1.6 | 2.7 | 1.6 | 1.2 | 1.7 |
| Battery (Wh) | 50 | - | 99 | 71 | 63 | 62 |
| Compare | Compare | Compare | Compare | Compare |
| Produkt | CPU | GPU | RAM | Anschlüsse | Display | Mobilität | Speicher | Zuverlässigkeit | Nutzerresonanz | Affordability |
|---|---|---|---|---|---|---|---|---|---|---|
| Apple MacBook Air 13.3" Retina | 6 | 28 | 5.4 | 38.2 | 85 | 94.6 | 15.7 | 98.3 | 72 | 72.9 |
| ASUS ROG Zephyrus 14" GA403WW-G14.R95080 Compare | 91.2 | 98.3 | 90.9 | 89.2 | 96.5 | 73.6 | 89.7 | 60.6 | 96.5 | 5.7 |
| Lenovo Legion Pro 7i Gen 10 16" Compare | 97.2 | 96.6 | 89 | 97.2 | 95.6 | 9.5 | 79.2 | 82 | 99.7 | 5.5 |
| HP OMEN Transcend Compare | 90.1 | 93.6 | 89.7 | 89.2 | 96.5 | 72.2 | 65.2 | 33.6 | 94.1 | 8.3 |
| Samsung Galaxy Book5 Pro 14" NP944XHA-KG3US Compare | 65.8 | 69.7 | 79.5 | 83.1 | 91.5 | 89.5 | 79.2 | 82 | 96.5 | 20 |
| Dell Premium 14.5" LDA14250-7667SLV-PUS Compare | 87.1 | 69.7 | 89 | 65.9 | 97.2 | 61.1 | 65.2 | 33.6 | 96.5 | 14 |
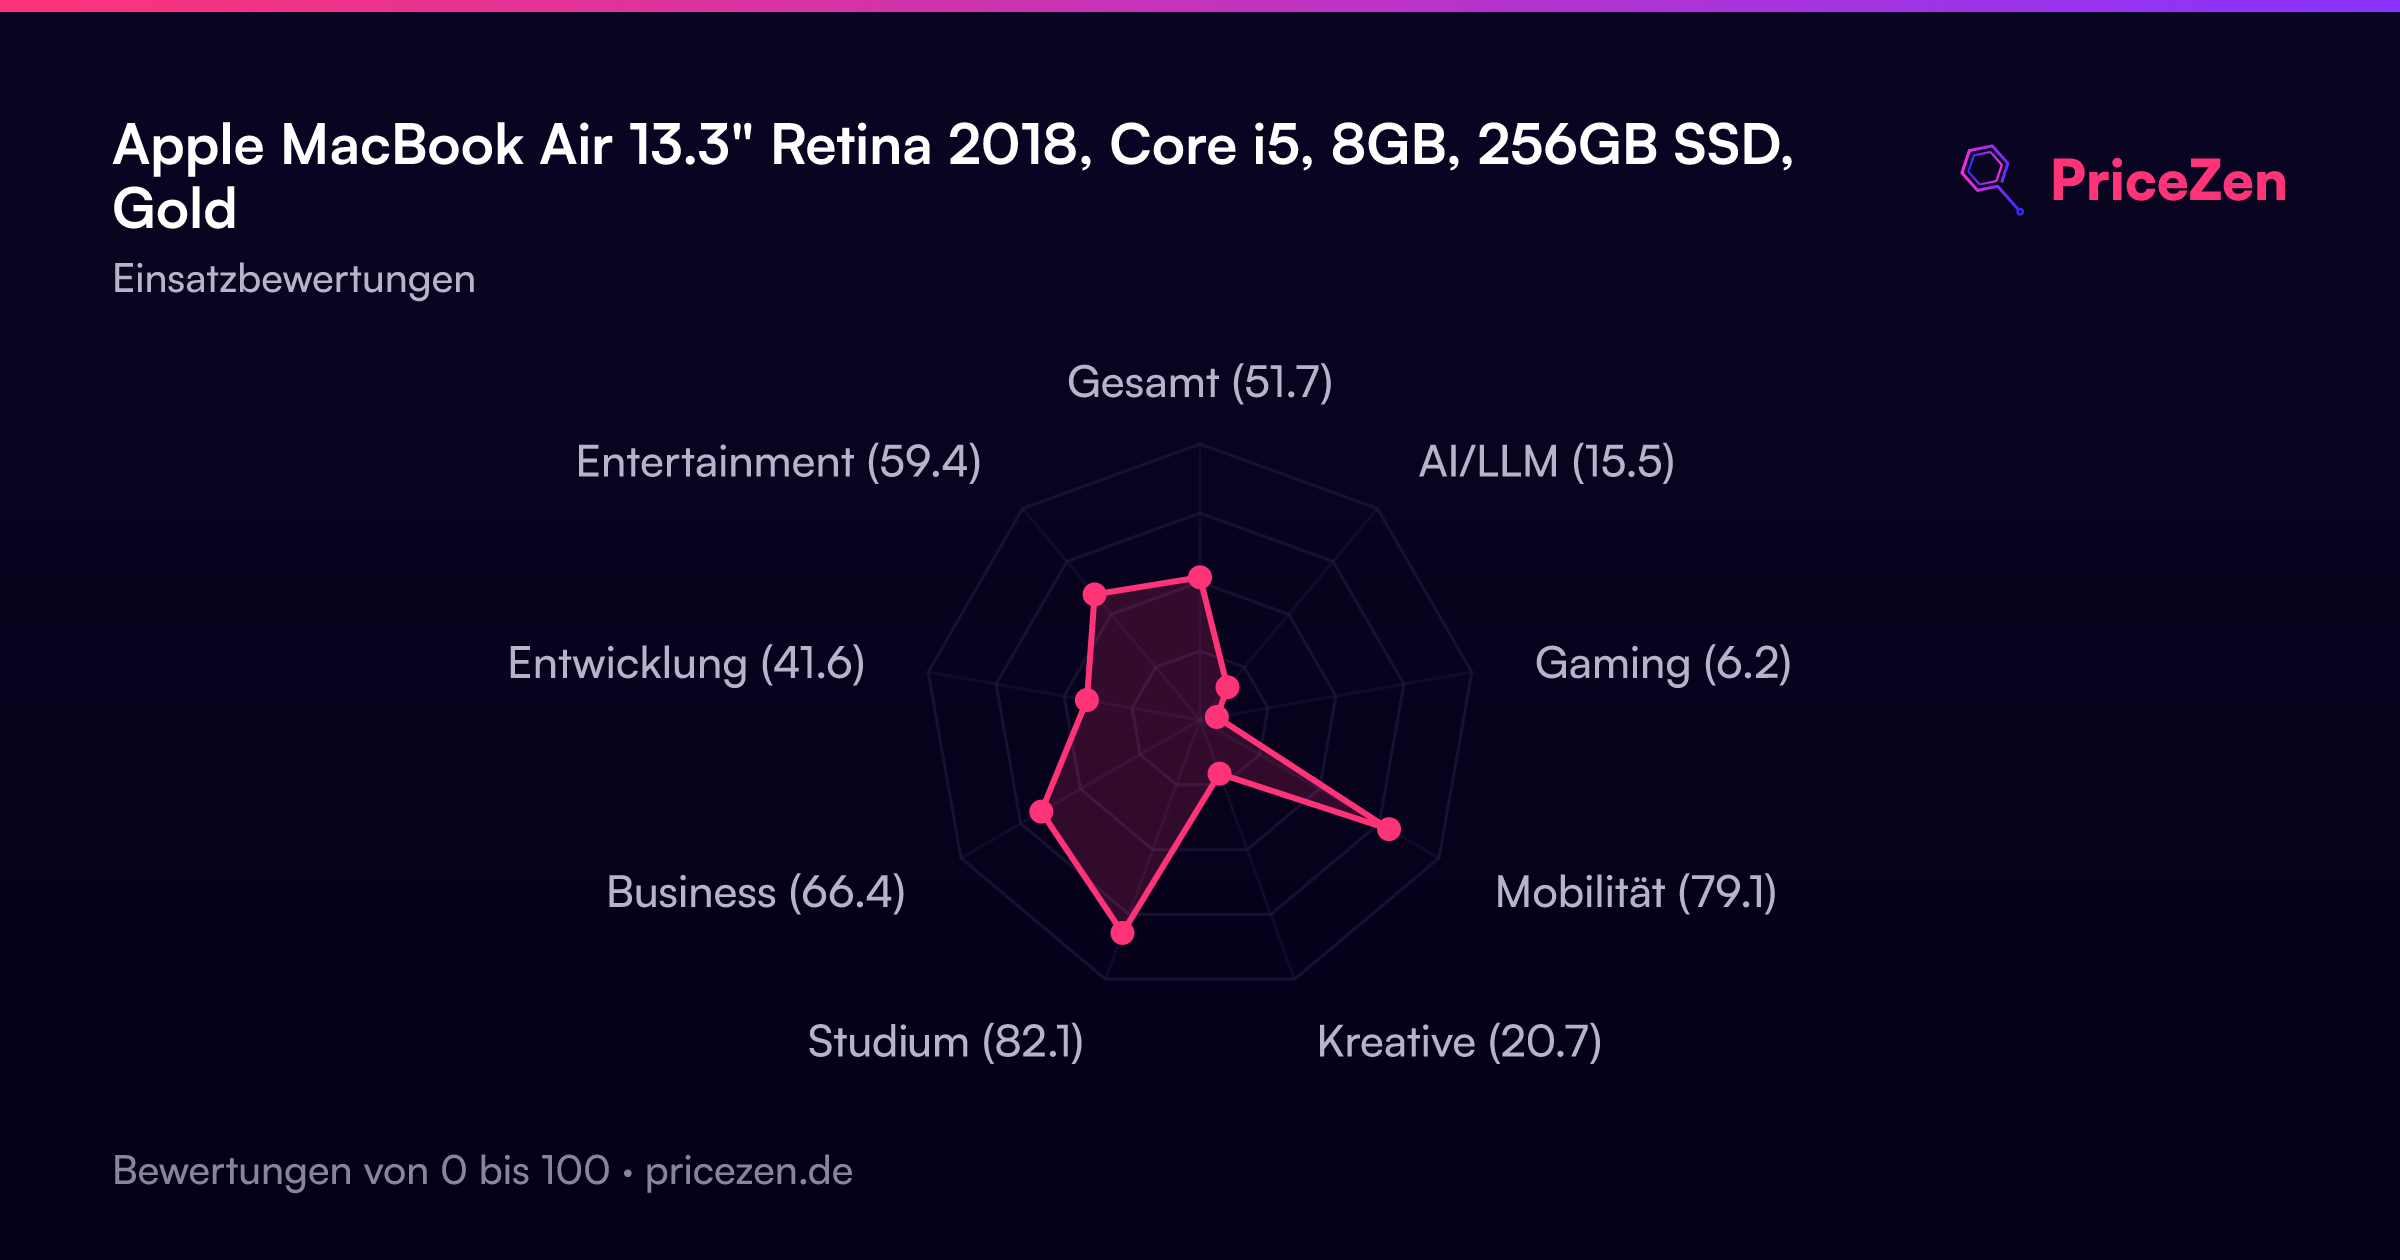
Bewertung nach Einsatzbereich
- Gesamt51.7
- AI/LLM15.5
- Gaming6.2
- Mobilität79.1
- Kreative20.7
- Studium82.1
- Business66.4
- Entwicklung41.6
- Entertainment59.4
Ein ausführlicher Testbericht folgt in Kürze. Die technischen Daten, Bewertungen, Preise und Diagramme oben sind stets aktuell.