Neu
Lexar NM790 512GB PCIe 4.0 x4 NVMe M.2 2280
Capacity 512GB
Form Factor M.2 2280
Interface PCIe 4.0 x4
Read Speed 7,200 MB/s
NAND TLC
Endurance 500 TBW

59 Gesamtbewertung
Derzeit kein aktueller Händlerpreis
Überblick
Vor- und Nachteile
Vorteile
- Strong random (92nd percentile) 92nd
- Strong endurance (84th percentile) 84th
- Strong speed (79th percentile) 79th
Nachteile
- Below average affordability (0th percentile)
- Below average capacity (35th percentile)
Die Fakten
Leistung
Technische Daten
Alle technischen Daten
Drive
| Capacity | 512 |
| Form Factor | M.2 2280 |
| Interface | PCIe 4.0 x4 |
| Protocol | NVMe |
| PCIe Generation | 4 |
| External | No |
Performance
| Sequential Read (MB/s) | 7200 |
| Sequential Write (MB/s) | 4400 |
| Random Read (IOPS) | 800000 |
| Random Write (IOPS) | 800000 |
Hardware
| NAND | TLC |
| DRAM Cache | No |
Reliability
| Endurance (TBW) | 500 |
| MTBF (hours) | 1500000 |
Im Vergleich
| Spec | Lexar NM790 | Western Digital WD_BLACK SN8100 | Samsung 9100 PRO | Kingston FURY Renegade | Crucial T700 | SanDisk WD_BLACK |
|---|---|---|---|---|---|---|
| Capacity | 512GB | 4TB | 8TB | 4TB | 2TB | 8TB |
| Form Factor | M.2 2280 | M.2 2280 | M.2 2280 | M.2 2280 | M.2 2280 | M.2 2280 |
| Interface | PCIe 4.0 x4 | PCIe 5.0 x4 | PCIe 5.0 x4 | PCIe 4.0 x4 | PCIe 5.0 x4 | PCIe 5.0 x4 |
| Seq Read | 7,200 MB/s | 14,900 MB/s | 14,800 MB/s | 7,300 MB/s | 12,400 MB/s | 14,900 MB/s |
| Nand Type | TLC | TLC | TLC | TLC | TLC | TLC |
| Dram Cache | false | false | true | true | true | true |
| Endurance | 500 TBW | 2400 TBW | 4800 TBW | 4000 TBW | 1200 TBW | 4800 TBW |
| Compare | Compare | Compare | Compare | Compare |
| Produkt | Speed | Random | Feature | Capacity | Endurance | Affordability |
|---|---|---|---|---|---|---|
| Lexar NM790 | 79.4 | 91.7 | 52.8 | 34.9 | 84 | 0 |
| Western Digital WD_BLACK SN8100 Compare | 99.7 | 99.6 | 85.9 | 92.5 | 80.4 | 8.5 |
| Samsung 9100 PRO Compare | 99.2 | 99.8 | 99.7 | 98.1 | 85.7 | 2 |
| Kingston FURY Renegade Compare | 93.4 | 94.4 | 93.9 | 92.5 | 94 | 10.9 |
| Crucial T700 Compare | 96.7 | 97.7 | 97.5 | 78.6 | 82.5 | 22.2 |
| SanDisk WD_BLACK Compare | 99.1 | 99.3 | 97.5 | 98.1 | 80.4 | 3.4 |
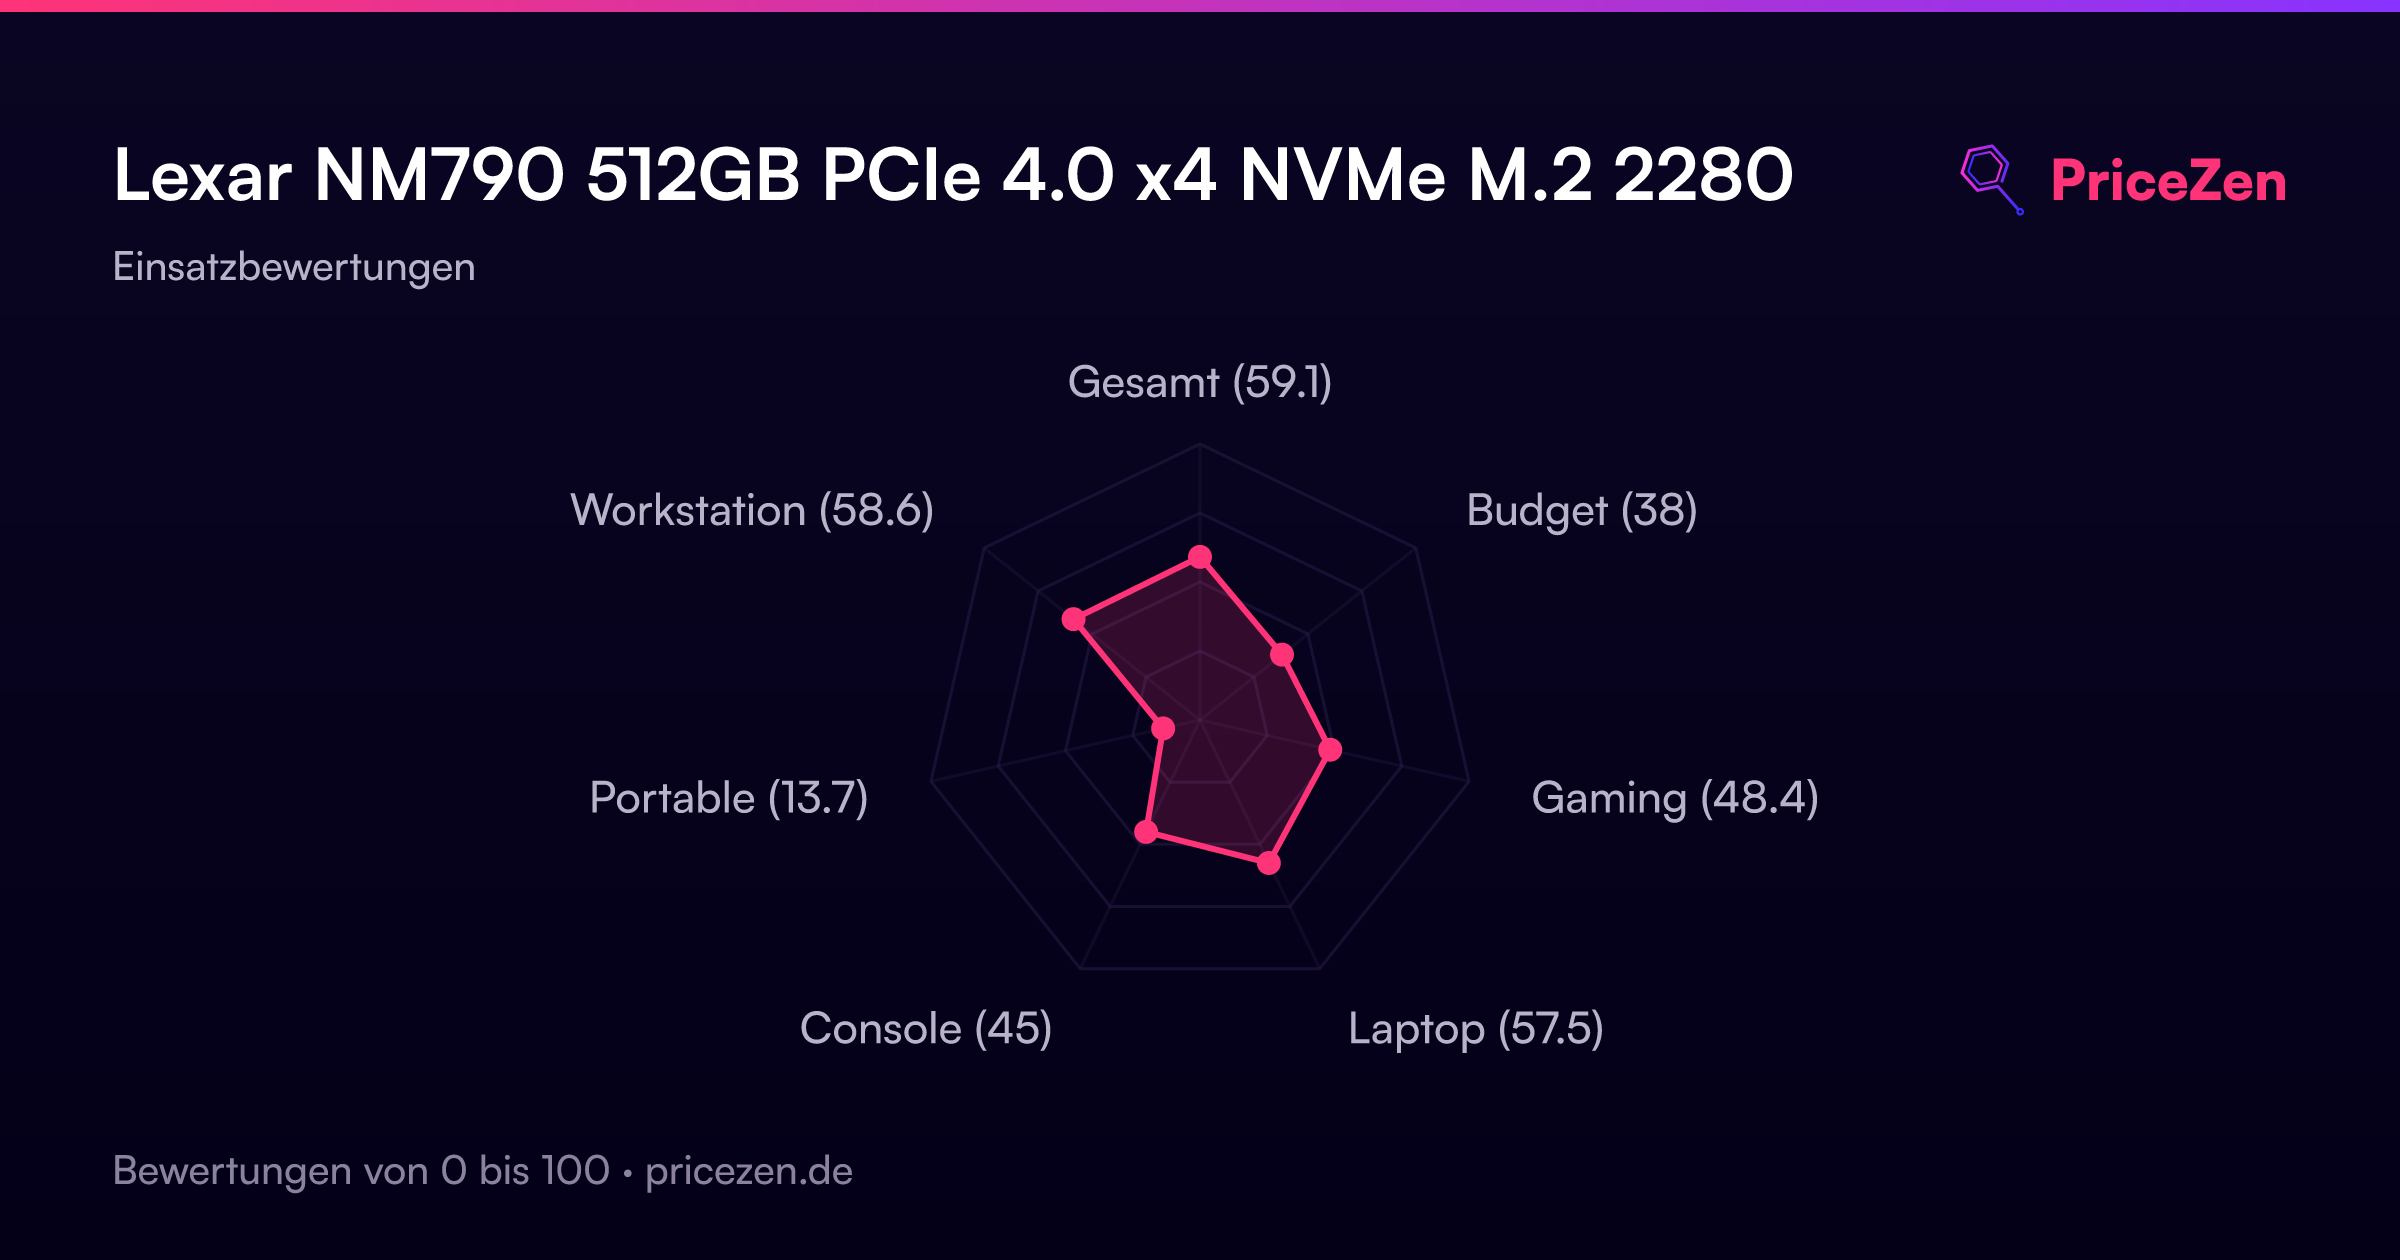
Bewertung nach Einsatzbereich
- Gesamt59.1
- Budget38
- Gaming48.4
- Laptop57.5
- Console45
- Portable13.7
- Workstation58.6
Ein ausführlicher Testbericht folgt in Kürze. Die technischen Daten, Bewertungen, Preise und Diagramme oben sind stets aktuell.