Lenovo ThinkStation P2 Gen 2 2026, Core Ultra 7 265, 32GB, 1TB SSD + 1TB SSD, RTX 5060, Black
CPU Intel Core Ultra 7 265
RAM 32 GB
Storage 2 TB
GPU NVIDIA GeForce RTX 5060
Form Factor mid-tower
psu w 500
OS Windows 11 Pro

82 Overall Score
No current retailer price
Snapshot
Pros & Cons
Pros
- Strong cpu (88th percentile) 88th
- Strong port selection (87th percentile) 87th
- Strong storage (83rd percentile) 83rd
- Strong gpu (80th percentile) 80th
Cons
The proof
Performance
Specifications
Full Specifications
Processor
| CPU | Intel Core Ultra 7 265 |
| Cores | 20 |
| Frequency | 2.4 GHz |
| L3 Cache | 30 MB |
Graphics
| GPU | NVIDIA GeForce RTX 5060 |
| Type | Discrete |
| VRAM | 8 GB |
| VRAM Type | GDDR7 |
Memory & Storage
| RAM | 32 GB |
| RAM Generation | DDR5 |
| Storage 1 | 1 TB |
| Storage 1 Type | SSD |
| Storage 2 | 1 TB |
| Storage 2 Type | SSD |
Build
| Form Factor | mid-tower |
| PSU | 500 |
Connectivity
| USB-C Ports | 1 |
| USB Ports | 8 |
| HDMI | 1x HDMI 2.1 |
| DisplayPort | 2x DisplayPort 1.4 |
| Wi-Fi | Wi-Fi 7 |
| Bluetooth | Bluetooth 5.4 |
| Ethernet | Gigabit Ethernet |
System
| OS | Windows 11 Pro |
vs Competition
| Spec | Lenovo ThinkStation P2 Gen 2 | Apple Mac Studio M5 Max | Dell Desktop ECT1250 | HP OMEN GT16-0364 | ASUS ROG GM700 | MSI Aegis ZS2 A9NVP-1407US |
|---|---|---|---|---|---|---|
| CPU | Intel Core Ultra 7 265 | Apple M5 Max | Intel Core Ultra 7 265 | AMD Ryzen 7 8700F | AMD Ryzen 7 9800X3D | AMD Ryzen 9 9900X |
| RAM (GB) | 32 | 36 | 32 | 32 | 32 | 32 |
| Storage (GB) | 2048 | 1024 | 2048 | 1024 | 2048 | 2048 |
| GPU | NVIDIA GeForce RTX 5060 | Apple (32-Core) | Intel UHD Graphics | NVIDIA GeForce RTX 5070 | NVIDIA GeForce RTX 5070 Ti | NVIDIA GeForce RTX 5070 |
| Form Factor | mid-tower | mini | sff | mid-tower | mid-tower | mid-tower |
| Psu W | 500 | 480 | 180 | 850 | 850 | 750 |
| OS | Windows 11 Pro | macOS | Windows 11 Home | Windows 11 Home | Windows 11 Home | Windows 11 Home |
| Compare | Compare | Compare | Compare | Compare |
| Product | CPU | GPU | RAM | Ports | Storage | Reliability |
|---|---|---|---|---|---|---|
| Lenovo ThinkStation P2 Gen 2 | 88.2 | 79.7 | 72.3 | 86.9 | 82.7 | 70 |
| Apple Mac Studio M5 Max Compare | 95.7 | 85.1 | 92.4 | 88.9 | 68.8 | 99.3 |
| Dell Desktop ECT1250 Compare | 88.2 | 60.2 | 81.6 | 74.5 | 82.7 | 70 |
| HP OMEN GT16-0364 Compare | 69.5 | 90.8 | 87 | 97.9 | 53.4 | 70 |
| ASUS ROG GM700 Compare | 80.5 | 94.6 | 81.6 | 96 | 90 | 37.3 |
| MSI Aegis ZS2 A9NVP-1407US Compare | 92.4 | 90.8 | 87 | 90.3 | 82.7 | 37.3 |
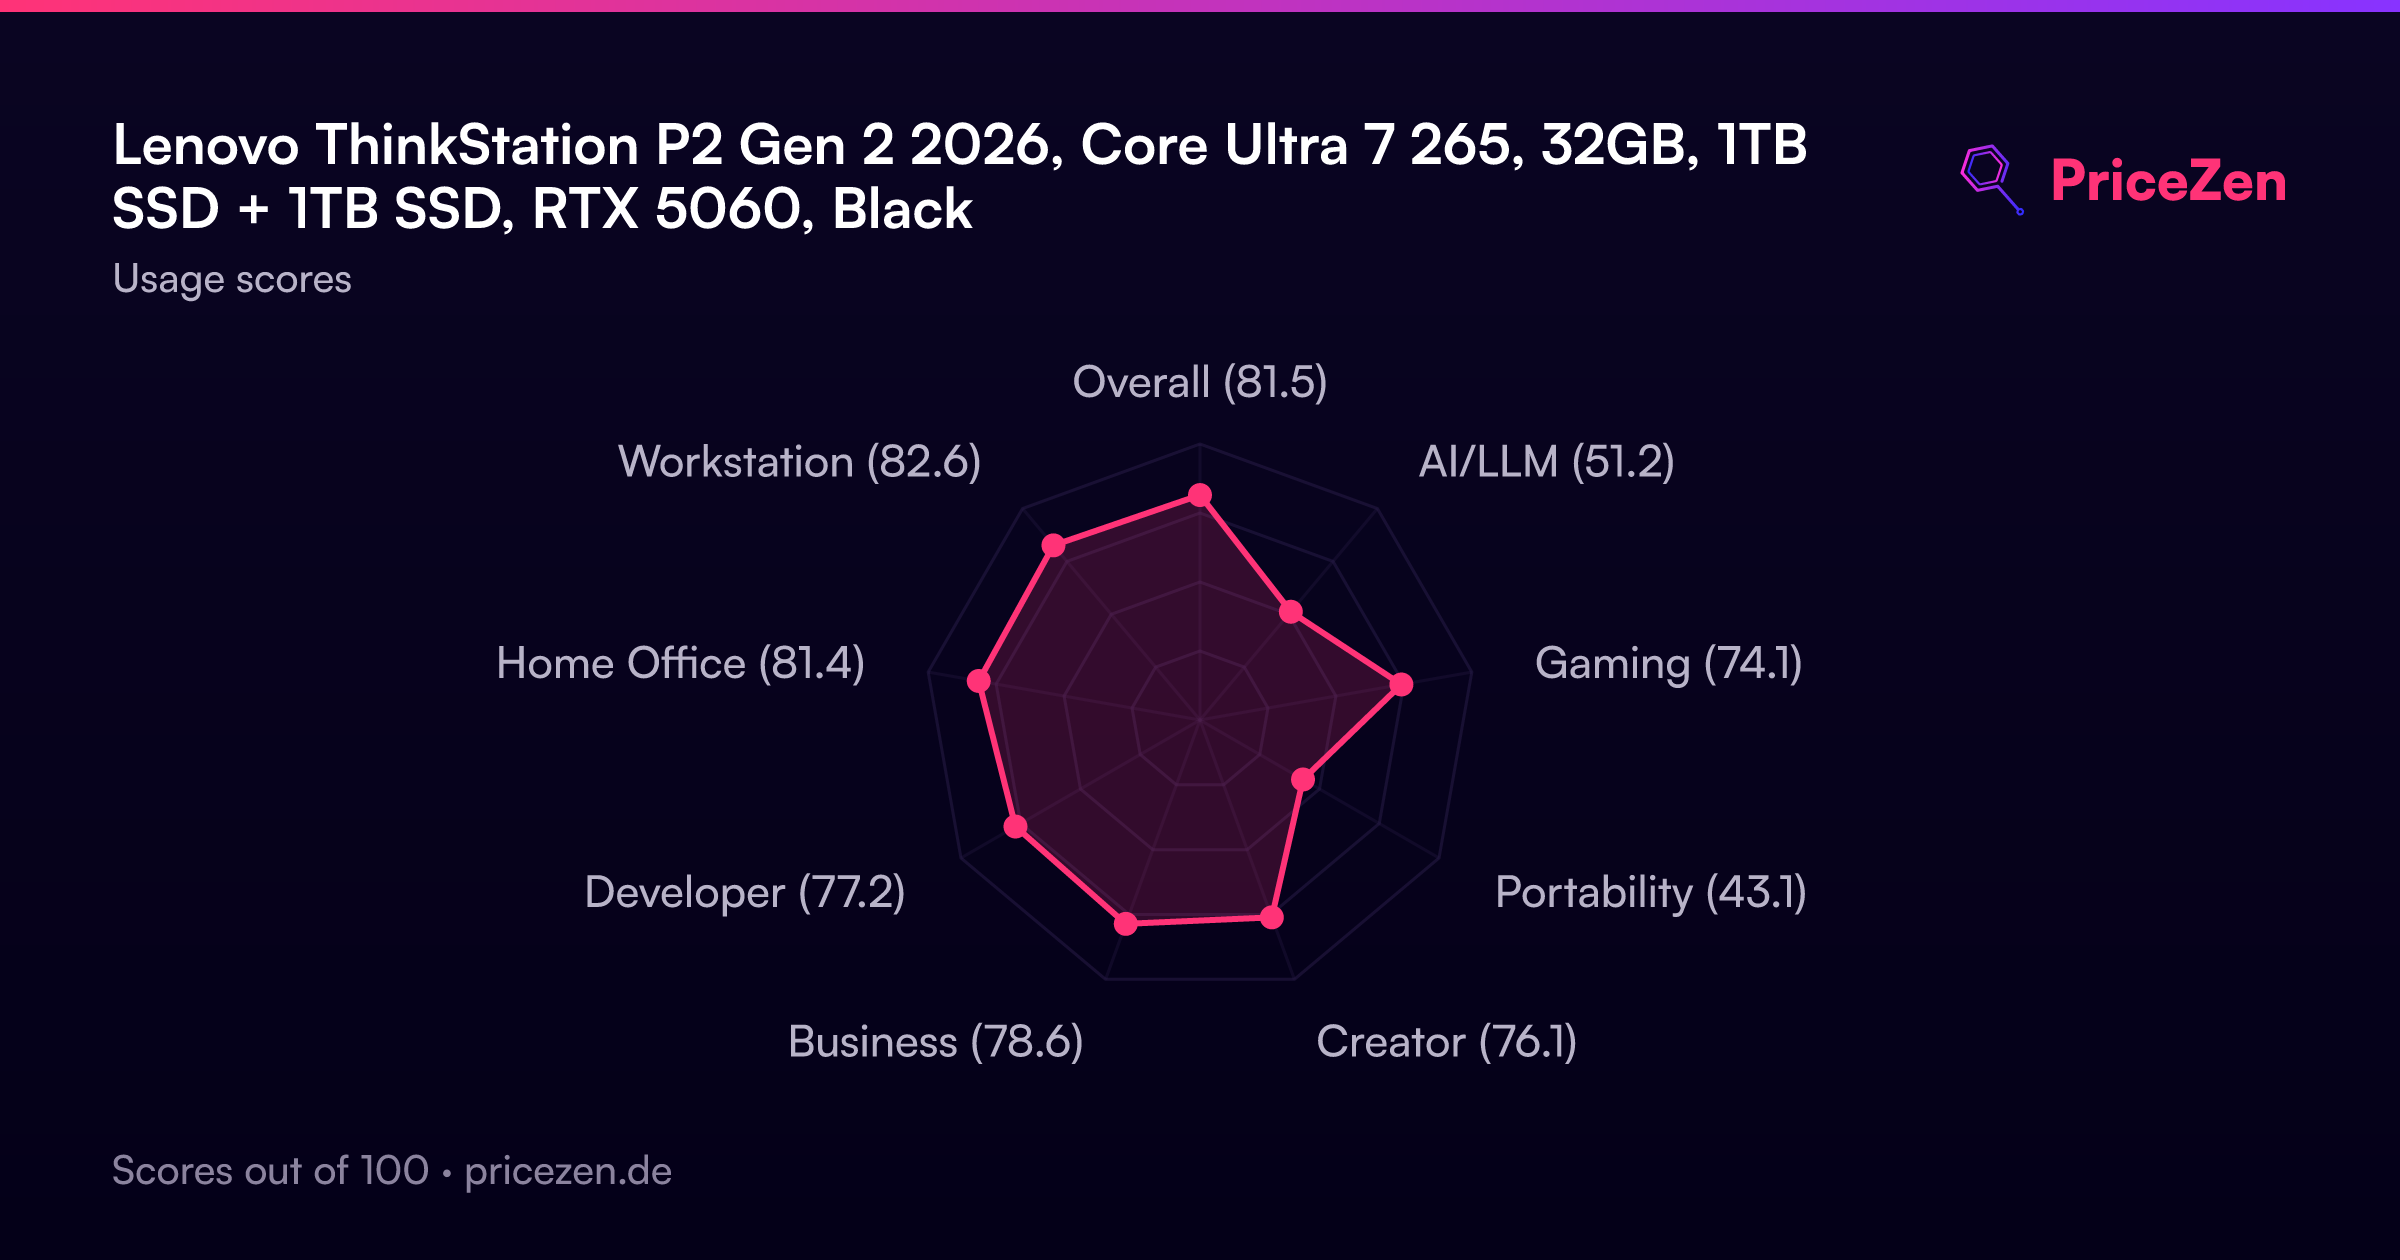
Usage Scores
- Overall81.5
- AI/LLM51.2
- Gaming74.2
- Portability43.1
- Creator76.2
- Business78.6
- Developer77.2
- Home Office81.4
- Workstation82.7
A full written review is coming soon. The specs, scores, prices and charts above are always up to date.
Other Configurations23
ThinkStation P2 Tower Gen 2Intel Core Ultra 7 26532GB1TBRaven Black€2,899ThinkStation P2 Tower Gen 2Intel Core Ultra 9 285K32GB2TBSchwarz€3,882ThinkStation P2 Tower Gen 2Intel Core Ultra 7 26532GB512GBThinkStation P2 Tower Gen 2Intel Core Ultra 9 28564GB2TBRaven BlackThinkStation P2 Tower Gen 2Intel Core Ultra 5 23532GB512GBThinkStation P2 Tower Gen 2Intel Core Ultra 7 26532GB512GBBlackThinkStation P2 Tower Gen 2Intel Core Ultra 5 23516GB1TBBlackThinkStation P2 Gen 2Intel Core Ultra 9 28564GB3TBBlackThinkStation P2 Gen 2Intel Core Ultra 7 26564GB3TBBlack
Show all 23 configurations
ThinkStation P2 Tower Gen 2Intel Core Ultra 5 2258GB512GBBlackThinkStation P2 Tower Gen 2Intel Core Ultra 7 26532GB512GBThinkStation P2 Tower Gen 2Intel Core Ultra 7 26532GB512GBThinkStation P2 Gen 2Intel Core Ultra 9 28532GB1536GBBlackThinkStation P2 Tower Gen 2Intel Core Ultra 5 22564GB1TBBlackThinkStation P2 Gen 2Intel Core Ultra 7 26564GB1TBBlackThinkStation P2 Gen 2Intel Core Ultra 5 22516GB1TBBlackThinkStation P2 Gen 2Intel Core Ultra 5 22532GB1536GBBlackThinkStation P2 Gen 2Intel Core Ultra 7 26516GB1536GBBlackThinkStation P2 Gen 2Intel Core Ultra 9 28564GB1TBBlackThinkStation P2 Gen 2Intel Core Ultra 7 26532GB512GBBlackThinkStation P2 Gen 2Intel Core Ultra 9 28532GB2TBBlackThinkStation P2 Gen 2Intel Core Ultra 5 22564GB2560GBBlackThinkStation P2 Tower Gen 2Intel Core Ultra 7 26532GB1TBRaven Black