New
AMD Radeon R5 240 1GB
GPU Radeon R5 240
VRAM 1GB
TDP 50 W
Class consumer

7 Overall Score
No current retailer price
Snapshot
Pros & Cons
Pros
- Strong affordability (100th percentile) 100th
Cons
- Below average ai (3rd percentile)
- Below average connectivity (5th percentile)
- Below average vram (6th percentile)
- Below average thermal (7th percentile)
What owners think
How owner sentiment changed over time
ExclusiveBased on when customers actually wrote their reviews - so you can see whether early praise held up.
2 written reviews, Nov 2026: 2 happy
Across all 3 store ratings: 4.7★. The chart counts the 2 written reviews.
Each dot is one written review, in the month it was written. Happy = 4-5★, mixed = 3★, unhappy = 1-2★.
The proof
Performance
Specifications
Full Specifications
Chipset
| GPU Chipset | Radeon R5 240 |
| Brand | AMD |
| Class | consumer |
Memory
| VRAM | 1 GB |
Compute
| Base Clock | 730 |
Performance
| PassMark G3D | 561 |
| GPU Compute | 435 |
Power & Cooling
| TDP | 50 |
Connectivity
| Interface | PCIe 3.0 |
Physical
| Form Factor | Low Profile |
vs Competition
| Spec | AMD Radeon R5 240 | ASUS GeForce RTX 5090 TUF Gaming | Gigabyte GeForce RTX 5070 Ti Eagle Ice | MSI GeForce RTX 5070 Ti Ventus 3X OC | ZOTAC GeForce RTX 5080 APOCALYPSE | Sapphire Radeon RX 7900 XTX NITRO+ |
|---|---|---|---|---|---|---|
| Chipset | Radeon R5 240 | GeForce RTX 5090 | GeForce RTX 5070 Ti | GeForce RTX 5070 Ti | GeForce RTX 5080 | Radeon RX 7900 XTX |
| Vram | 1GB | 32GB GDDR7 | 16GB GDDR7 | 16GB GDDR7 | 16GB GDDR7 | 24GB GDDR6 |
| Boost Clock Mhz | - | 2407 | 2542 | 2482 | 2730 | 2680 |
| Tdp W | 50 | 575 | 300 | 300 | 360 | 339 |
| Memory Bus Bits | - | 512 | 256 | 256 | 256 | 384 |
| Ray Tracing | - | true | true | true | true | true |
| GPU Class | consumer | consumer | consumer | consumer | consumer | consumer |
| Compare | Compare | Compare | Compare | Compare |
| Product | AI | Rt | Vram | Raster | Feature | Thermal | Efficiency | Connectivity | Social Proof | Affordability |
|---|---|---|---|---|---|---|---|---|---|---|
| AMD Radeon R5 240 | 2.6 | 7.7 | 5.7 | 8 | 10.9 | 6.5 | 8.7 | 5.3 | 23.3 | 99.9 |
| ASUS GeForce RTX 5090 TUF Gaming Compare | 97.1 | 90.5 | 97.8 | 98.8 | 95.9 | 72.4 | 24.1 | 99.3 | 98.7 | 2.3 |
| Gigabyte GeForce RTX 5070 Ti Eagle Ice Compare | 79.5 | 88.7 | 86 | 89 | 95.9 | 91.7 | 72.2 | 94.1 | 93.3 | 26.6 |
| MSI GeForce RTX 5070 Ti Ventus 3X OC Compare | 79.5 | 92.5 | 86 | 89 | 95.9 | 91.7 | 72.2 | 94.1 | 83.8 | 23.1 |
| ZOTAC GeForce RTX 5080 APOCALYPSE Compare | 85.6 | 97.6 | 89.1 | 94.5 | 95.9 | 91.7 | 57.1 | 94.1 | 98.7 | 20.3 |
| Sapphire Radeon RX 7900 XTX NITRO+ Compare | 95.1 | 96.2 | 91.9 | 83.5 | 95.9 | 91.7 | 52 | 98.8 | 68.9 | 18.6 |
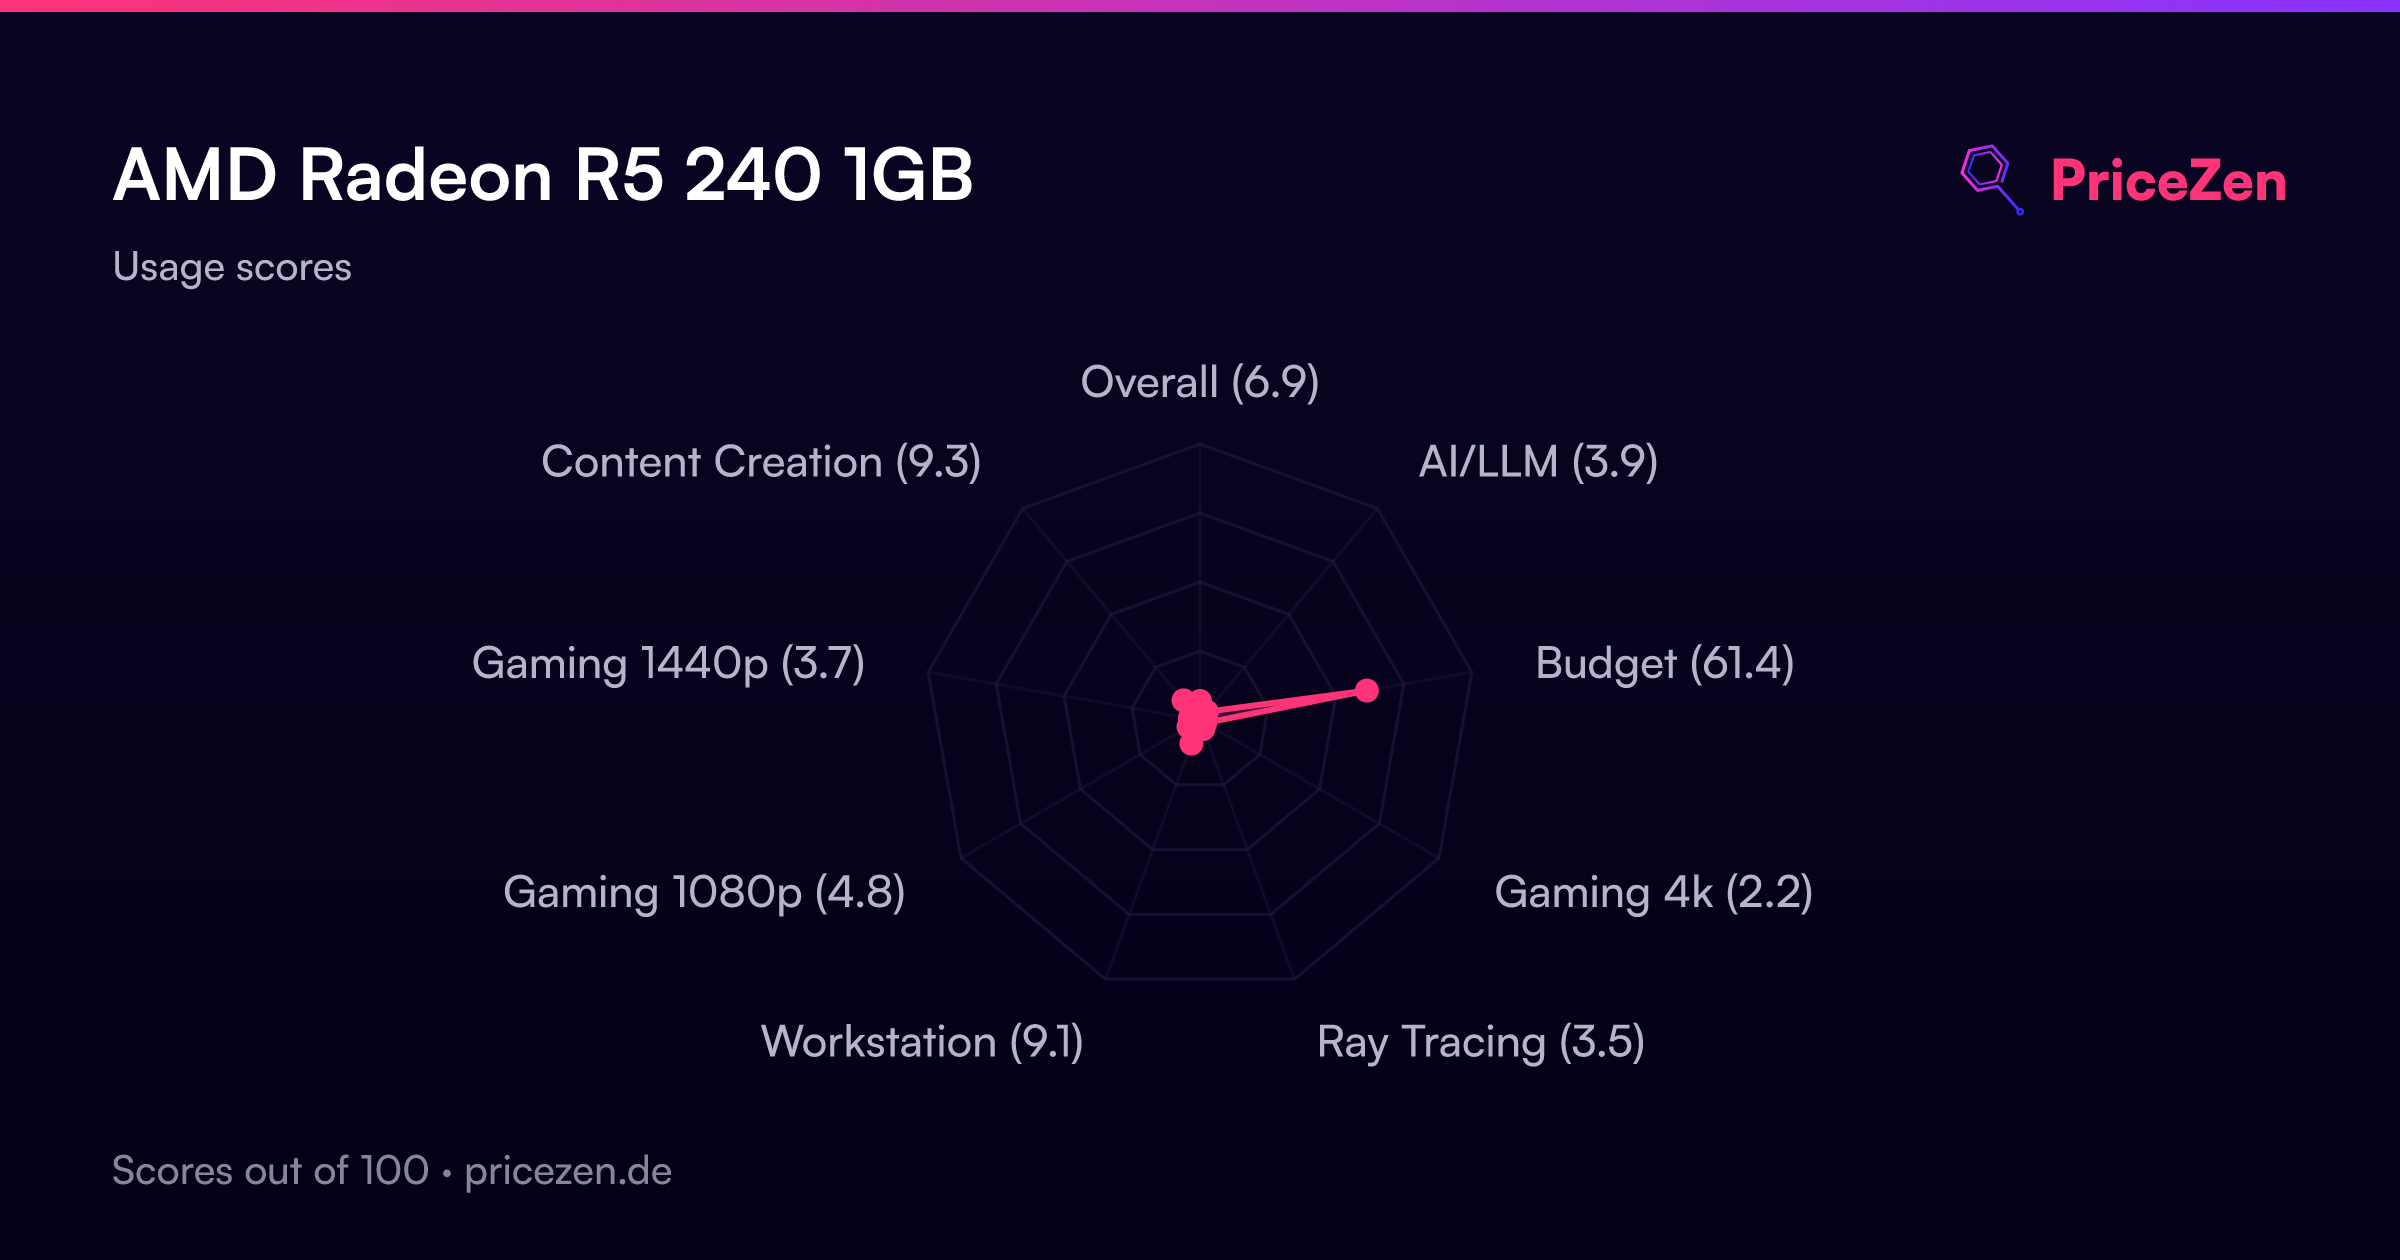
Usage Scores
- Overall6.9
- AI/LLM3.9
- Budget61.4
- Gaming 4k2.2
- Ray Tracing3.6
- Workstation9.1
- Gaming 1080p4.8
- Gaming 1440p3.7
- Content Creation9.3
A full written review is coming soon. The specs, scores, prices and charts above are always up to date.