HP Laptop , Core i5-1334U, 16GB, 512GB SSD, Natural Silver
CPU Intel Core i5 1334U
RAM 16 GB
Storage 512 GB
Screen 15.6" 1920x1080
GPU Intel Iris Xe Graphics
OS Windows 11 Home
Battery 41 Wh

36 Overall Score
No current retailer price
Snapshot
Pros & Cons
Pros
Cons
- Below average affordability (0th percentile)
- Below average port selection (13th percentile)
- Below average reliability (34th percentile)
The proof
Performance
Specifications
Full Specifications
Processor
| CPU | Intel Core i5 1334U |
| Cores | 10 |
| Frequency | 3.4 GHz |
| L3 Cache | 12 MB |
Graphics
| GPU | Intel Iris Xe Graphics |
| Type | Integrated |
| VRAM Type | Shared |
Memory & Storage
| RAM | 16 GB |
| RAM Generation | DDR4 |
| Storage | 512 GB |
| Storage Type | NVMe SSD |
Display
| Size | 15.6" |
| Resolution | 1920x1080 (Full HD) |
| Panel | IPS |
| Brightness | 300 nits |
Connectivity
| Wi-Fi | Wi-Fi 6 |
| Bluetooth | Bluetooth 5.4 |
Physical
| Battery | 41 Wh |
| OS | Windows 11 Home |
vs Competition
| Spec | HP Laptop 15-fd0125st | Apple MacBook Pro 14.2" M4 Max | ASUS ROG Zephyrus 14" GA403WW-G14.R95080 | Lenovo Legion Pro 7i Gen 10 16" | Samsung Galaxy Book5 Pro 14" NP944XHA-KG3US | Dell Premium 14.5" LDA14250-7667SLV-PUS |
|---|---|---|---|---|---|---|
| CPU | Intel Core i5 1334U | Apple M4 Max | AMD Ryzen AI 9 HX 370 | Intel Core Ultra 9 275HX | Intel Core Ultra 7 258V | Intel Core Ultra 7 255H |
| RAM (GB) | 16 | 64 | 32 | 32 | 32 | 32 |
| Storage (GB) | 512 | 4096 | 2048 | 1024 | 1024 | 1024 |
| Screen | 15.6" 1920x1080 | 14.2" 3024x1964 | 14" 2880x1800 | 16" 2560x1600 | 14" 2880x1800 | 14.5" 3200x2000 |
| GPU | Intel Iris Xe Graphics | Apple (40-Core) | NVIDIA GeForce RTX 5080 | NVIDIA GeForce RTX 5070 Ti | Intel Arc Graphics 140V | Intel Arc Graphics |
| OS | Windows 11 Home | macOS | Windows 11 Home | Windows 11 Home | Windows 11 Pro | Windows 11 Home |
| Weight (kg) | - | 1.6 | 1.6 | 2.7 | 1.2 | 1.7 |
| Battery (Wh) | 41 | 72 | - | 99 | 63 | 62 |
| Compare | Compare | Compare | Compare | Compare |
| Product | CPU | GPU | RAM | Ports | Screen | Portability | Storage | Reliability | Affordability |
|---|---|---|---|---|---|---|---|---|---|
| HP Laptop 15-fd0125st | 42.5 | 47.7 | 36.2 | 12.9 | 38.9 | 38.5 | 50.8 | 33.6 | 0 |
| Apple MacBook Pro 14.2" M4 Max Compare | 93.7 | 91.6 | 95.7 | 73.2 | 99.3 | 68.9 | 98.5 | 98.3 | 1.7 |
| ASUS ROG Zephyrus 14" GA403WW-G14.R95080 Compare | 91.2 | 98.3 | 90.9 | 89.2 | 96.5 | 73.6 | 89.7 | 60.6 | 5.7 |
| Lenovo Legion Pro 7i Gen 10 16" Compare | 97.2 | 96.6 | 89 | 97.2 | 95.6 | 9.5 | 79.2 | 82.1 | 5.5 |
| Samsung Galaxy Book5 Pro 14" NP944XHA-KG3US Compare | 65.7 | 69.6 | 79.4 | 83.1 | 91.5 | 89.5 | 79.2 | 82.1 | 20.1 |
| Dell Premium 14.5" LDA14250-7667SLV-PUS Compare | 87.1 | 69.6 | 89 | 65.9 | 97.2 | 61.1 | 65.1 | 33.6 | 14 |
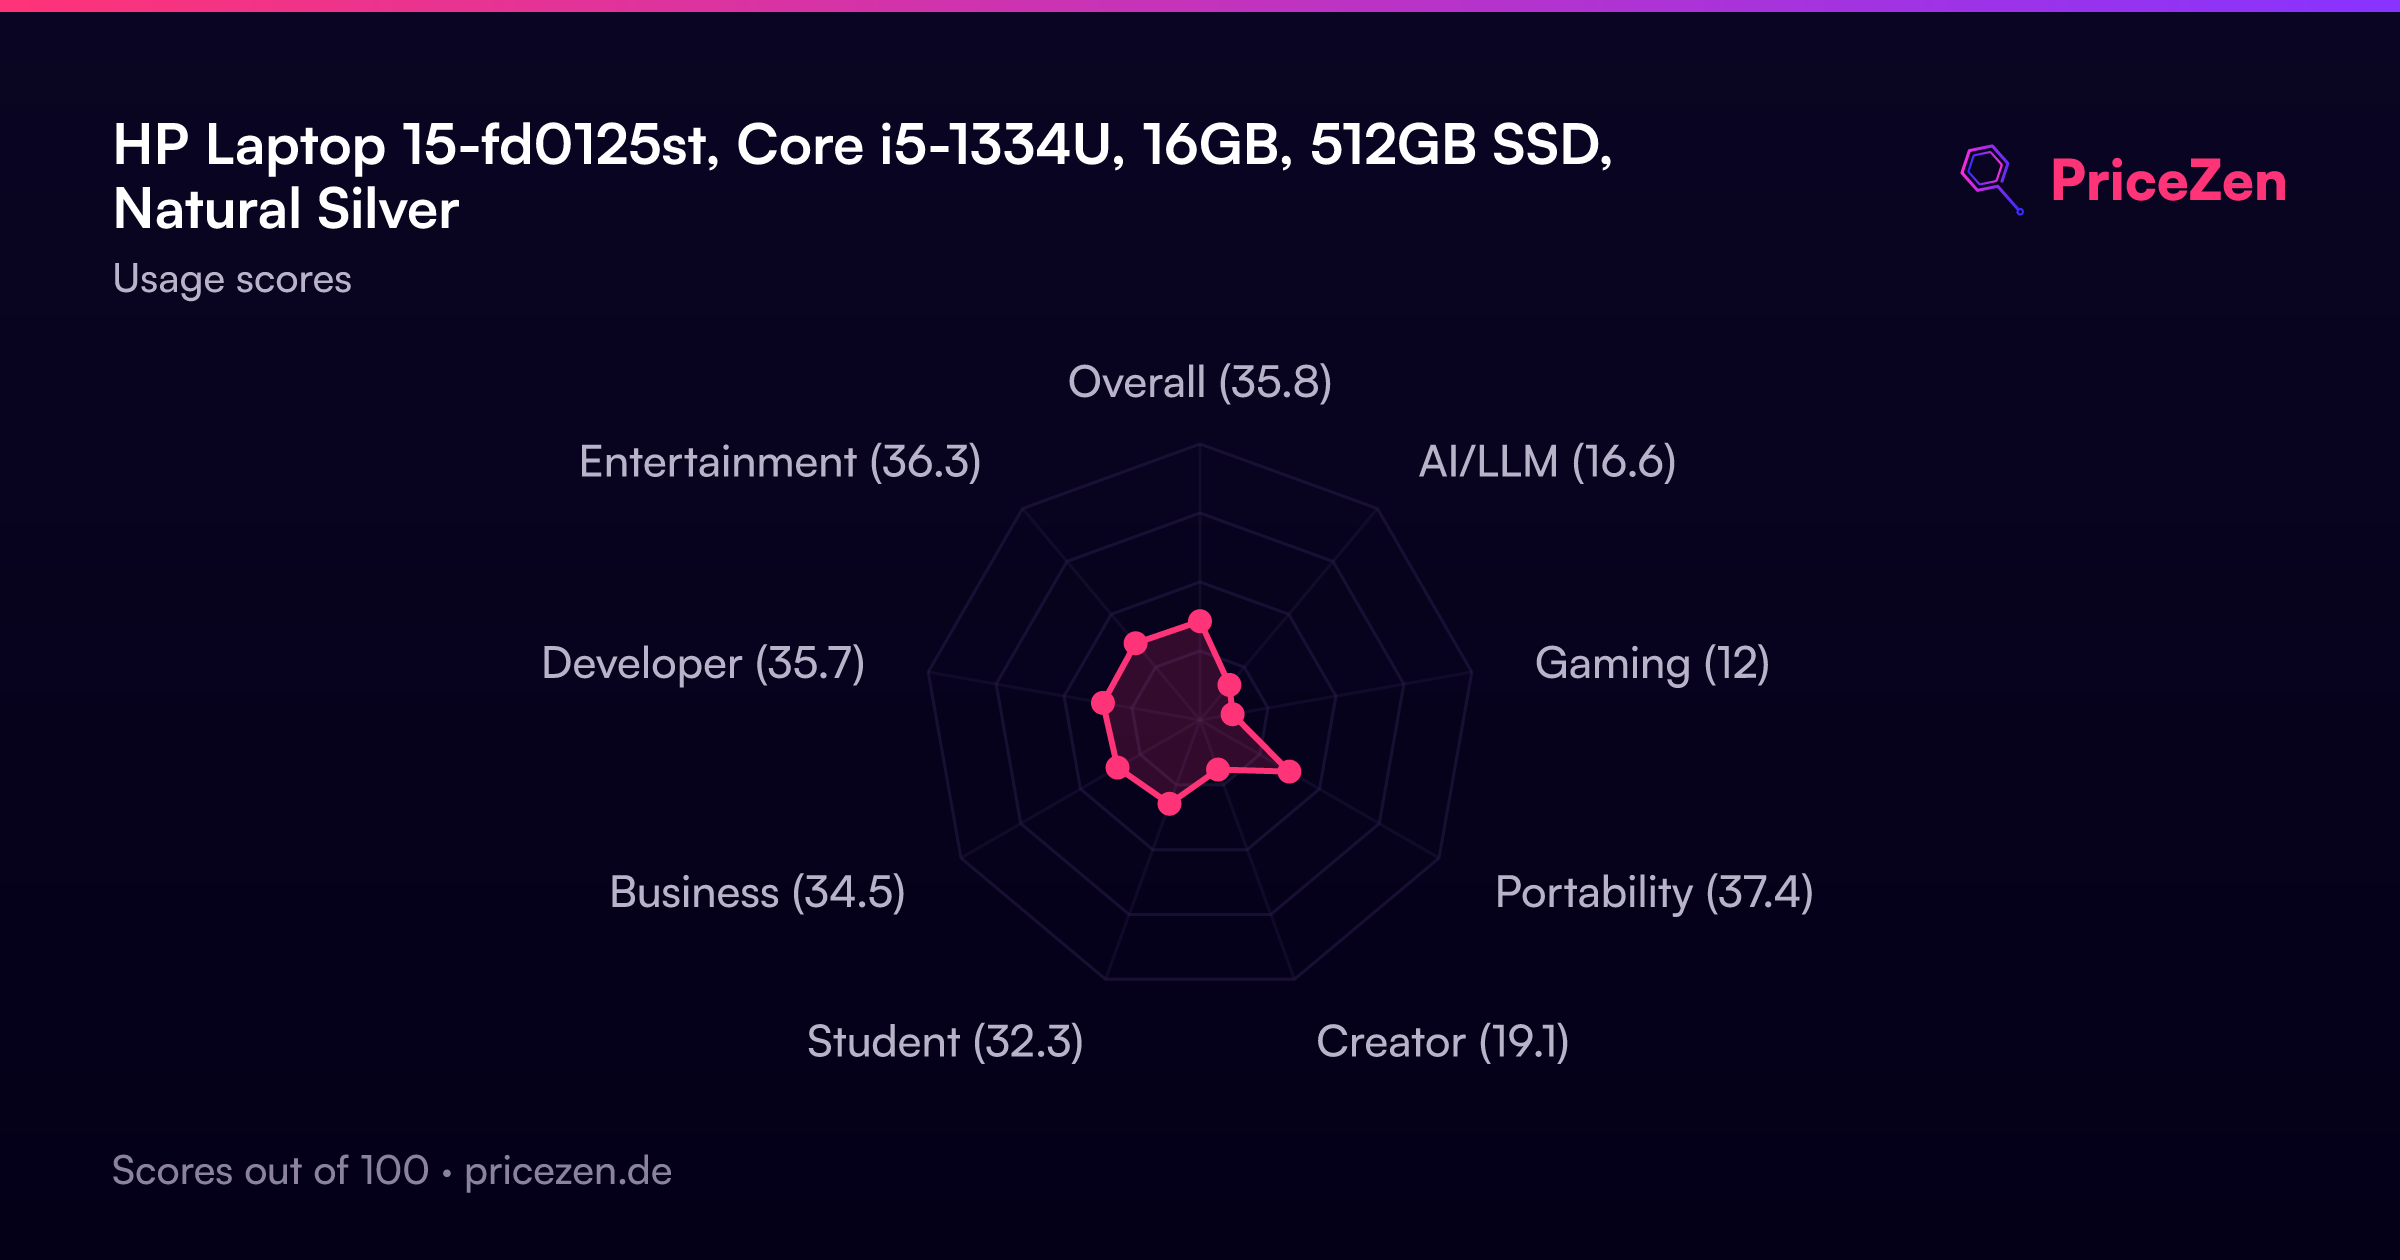
Usage Scores
- Overall35.8
- AI/LLM16.6
- Gaming12
- Portability37.4
- Creator19.1
- Student32.3
- Business34.5
- Developer35.7
- Entertainment36.3
A full written review is coming soon. The specs, scores, prices and charts above are always up to date.
Other Configurations60
HP Notebooks 15-fd0107dsIntel Processor N1004GB128GBNatural Silver/Moonlight Blue15 Series 15-fd0125dsIntel Processor N1004GB128GBSilverHP Laptop 15-fd0083caIntel Core i3 1315U16GB512GBSilver15-fd0127dxIntel Core i7 1355U16GB512GBNatural Silver15-FD0131WMIntel N-Series N3058GB256GBNatural Silver15-fd0030caIntel Core i5 1340P16GB512GBNatural silver15-fd0001dxIntel Processor N1004GB128GBSilver15 Series 15-FD0835NRIntel Core i5 1334U8GB256GBSilver15 Laptop 15-Fd0127dxIntel Core i7 1355U16GB512GBNatural Silver
Show all 60 configurations
15-fd0083wmIntel N-Series N2004GB128GBRed15-fd0101dsIntel Processor N1004GB128GBDiamond White15-fd0113dxIntel N-Series N3058GB128GBNatural Silver15 Series 15-fd0122dsIntel Processor N1004GB128GBMoonlight Blue15-fd0522nrIntel N-Series N2004GB128GBNatural Silver15-fd0150caIntel Core i5 1334U16GB512GB15-fd0567nrIntel Core i5 1235U16GB1TBEssential 15-fd0077nrIntel Core i7 1355U8GB256GBJet black15-fd0215dxIntel Core i5 1334U16GB512GBNatural Silver2025 15-fd0130wmIntel N-Series N30532GB1TBBlue15-fd0123dxIntel Core i3 1315U16GB2TBSilver15-fd0000 15-fd0965nrIntel Core i7 1355U16GB512GBNatural SilverLaptop 15 15-fd0150caIntel Core 5 120U16GB512GBNatural silver15-fd0001dxIntel Processor N1008GB128GBSilver15-FD0373NRIntel N-Series N2004GB256GBWarm GoldLaptop 15 15-FD0083WMIntel N-Series N20016GB128GBGrayPavilion 15-fd0153dxIntel Core i3 1315U8GB256GBNatural Silver15 Series 15-fd0128caIntel Core i5 1334U16GB512GBChalkboard Gray15-fd0082wmIntel N-Series N2004GB128GBMoonlight Blue15-fd0102dsIntel Processor N1004GB128GBMoonlight Blue, Natural Silver15-fd0109dsIntel Processor N1004GB128GBSunkissed Plum15-fd0118caIntel Processor N1004GB128GBJet Black15-fd0125stIntel Core i5 1334U16GB512GBNatural Silver15 Series 15-fd0121dsIntel Processor N1004GB128GBDiamond White15-fd0609nrIntel Core 3 N3558GB256GBNatural silver15-fd0586nrIntel Core i5 1334U8GB512GBNatural Silver15-fd0106dsIntel Processor N1004GB128GBDiamond white15-fd0154wmIntel Core i5 1334U8GB512GBNatural Silver15 Series 15-fd0123dsIntel Processor N1004GB128GBWinter Lavender15-fd0083wmIntel Pentium 44GB128GBScarlet Red15 Series 15-fd0552dsIntel Core i5 1334U8GB256GBMoonlight Blue15-fd0124dsIntel Processor N1004GB128GBChai Latte15-fd0335nrIntel Core i5 1334U12GB512GBNatural Silver15-fd0123dxIntel Core i3 1315U16GB1TBNatural SilverHP 15-fd0127dxIntel Core i7 1355U32GB1TBSilverEssential 15-fd0054nrIntel Core i5 1334U8GB256GBNatural silver15-fd0182wmIntel Core i7 1355U16GB1TBSilverHP 15 15-fd0127dxIntel Core i7 1355U64GB2TBNatural Silver15-fd0122dsIntel Processor N1504GB128GBMoonlight BlueEssential 15-fd0215dxIntel Core i5 1334U16GB512GBSilver15-fd0183wmIntel Core i7 1355U16GB1TBSilver15-fd0102dxIntel Processor N1004GB128GBPale Rose Gold15-fd0101dxIntel Processor N1004GB128GBNatural Silver15-fd0127dxIntel Core i7 1355U64GB2TBSilver15-fd0129dsIntel Processor N1004GB128GBChai Latte15-fd0055tgIntel N-Series N3058GB256GBSilverHP Laptop 15-fd0023dxIntel Core i3 1215U8GB256GBNatural Silver15-fd0039dsIntel N-Series N2004GB128GBGold15-fd0127dxIntel Core 7 150U32GB1TBNatural Silver15-fd0123dxIntel Core i3 1315U8GB256GBNatural Silver15-fd0123dxIntel Core i3 1315U8GB256GBNatural Silver